


 37 / 108

30
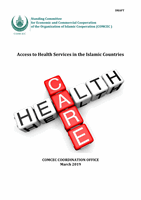
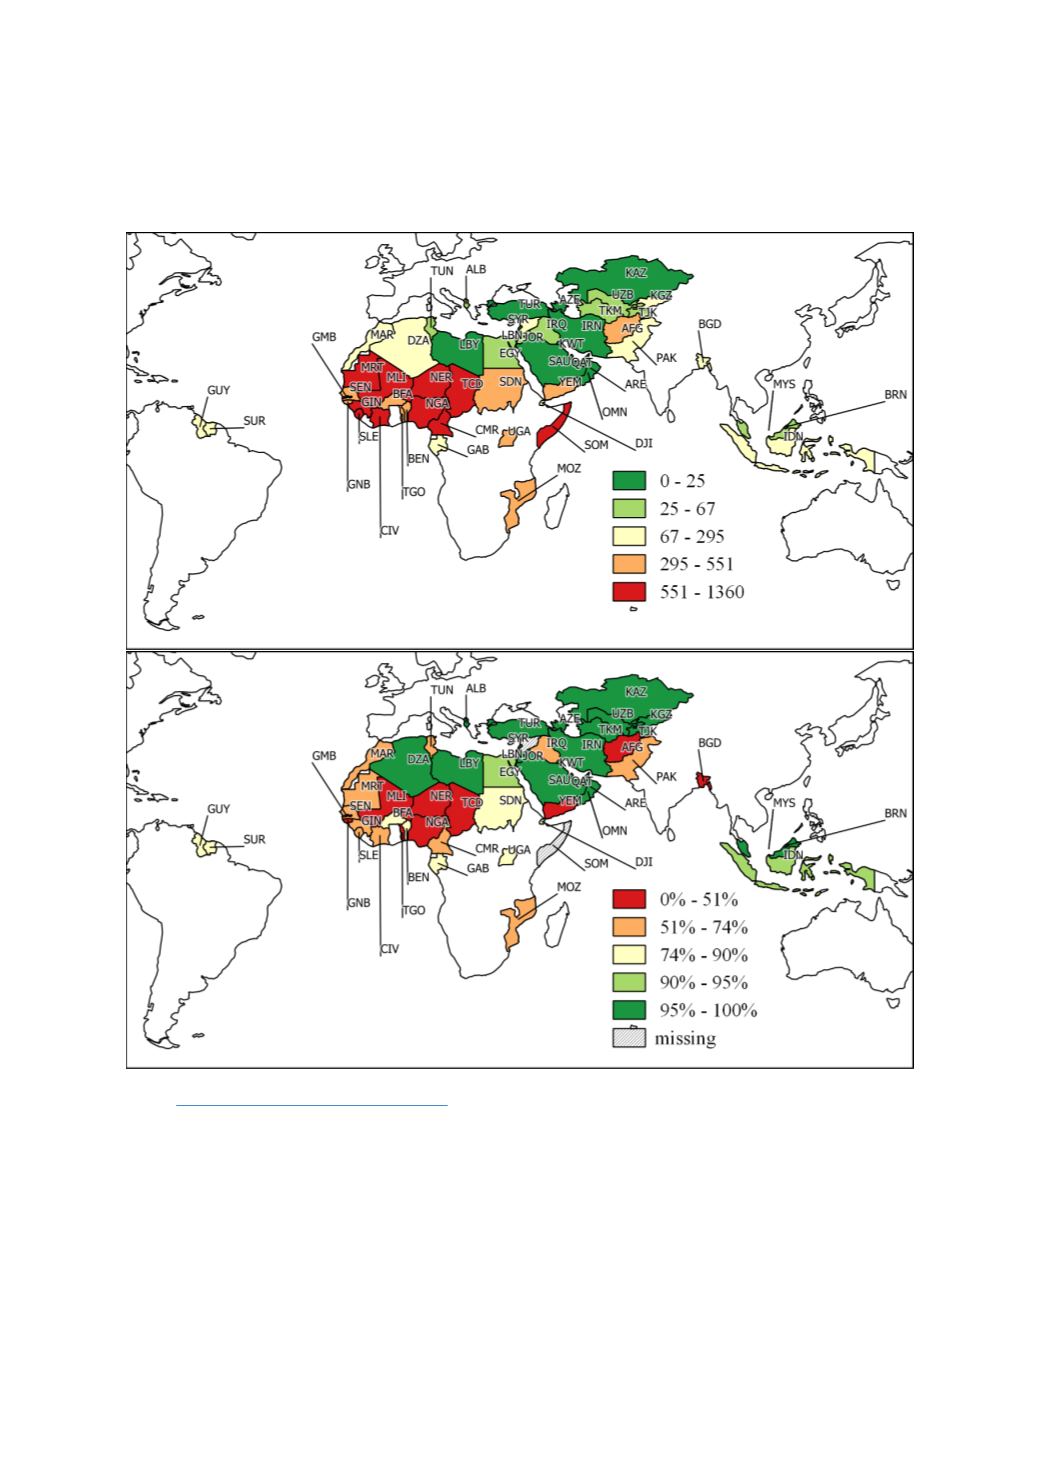
Figure 16: Maternal mortality ratio (per 100,000 live births) in the top and the proportion of births
attended by skilled health staff (% of total) in the bottom figure, OIC countries, latest data available
Source
: https://data.worldbank.org/topic/health Table 4outlines the historical trends in MMR and skilled birth attendance in OIC countries. MMR has
steadily declined for OIC countries and for the three groups of countries within the OIC over the 20-
year period reported i
n Table 4 .The current MMR status in OIC countries as reflected in the average
for the 2011-2015 period compares well with those for low income countries (average of 479 in 2015)
and it is on par with the average MMR in lower middle-income countries (average of 257 in 2015). The
intra-OIC differences in MMR reflected in
Table 4 is interesting. The difference between the best
performer, Kuwait (MMR of 4), and the worst performer, Sierra Leone (MMR of 1360), paints a picture
of strikingly different maternal health situations with the OIC membership. The intra-group averages
i
n Table 4further establishes that the African group is indeed the worst performer; and that also by a