


 35 / 108

28
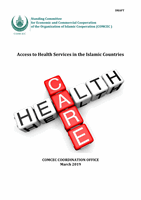
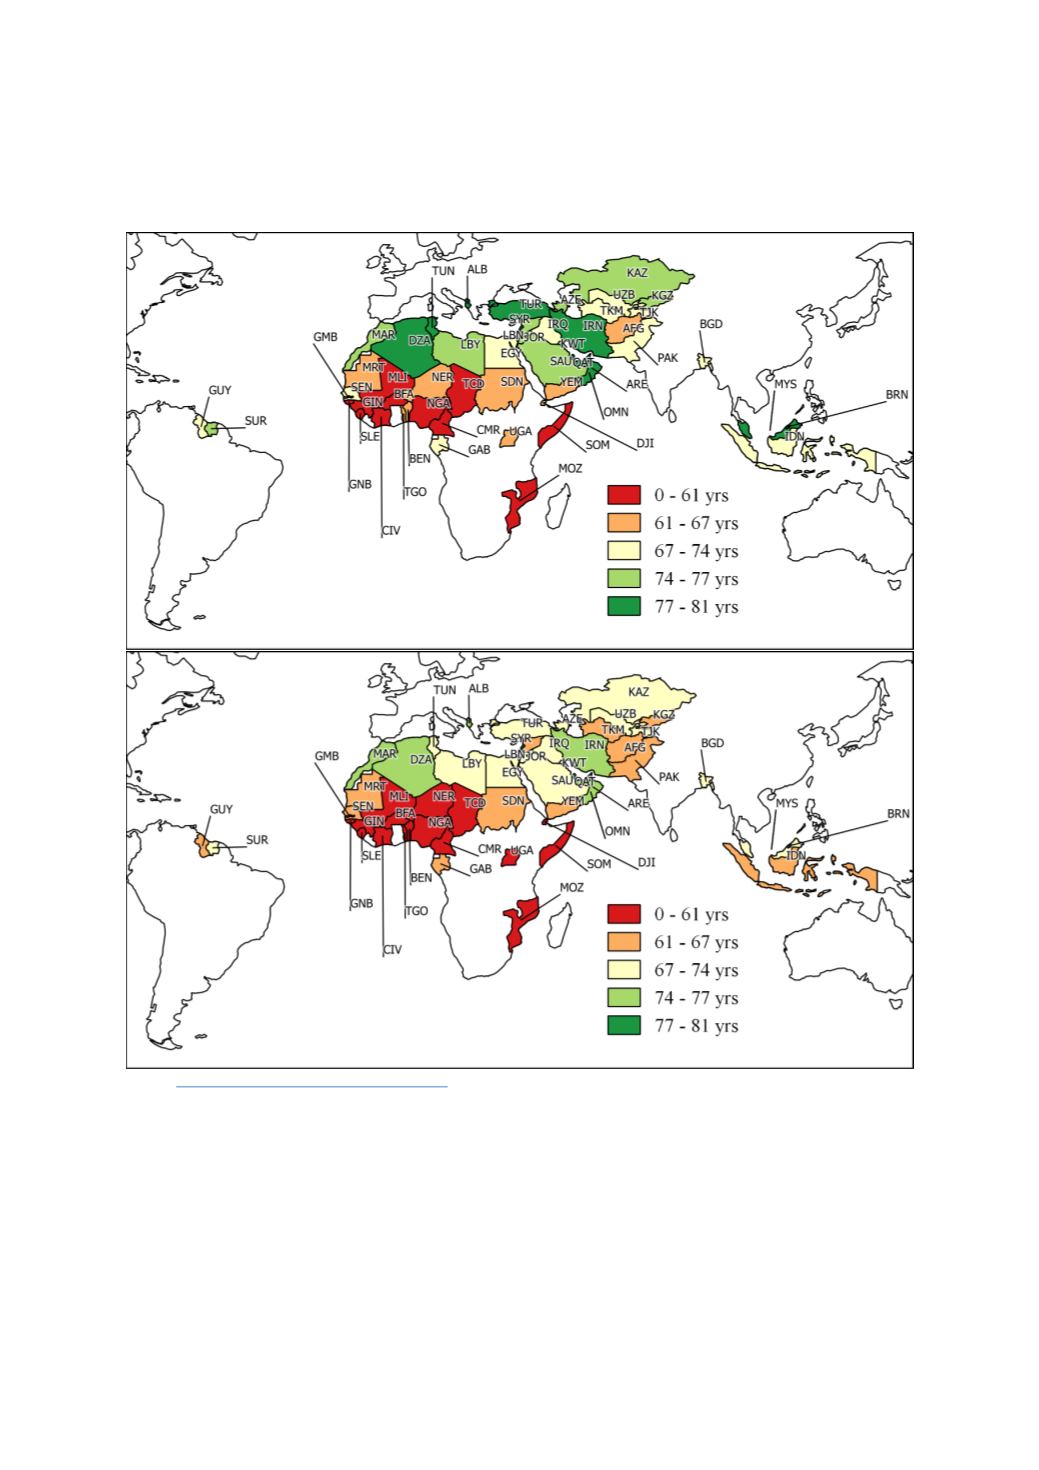
Figure 15: Female (top figure) and male (bottom) life expectancy at birth for OIC member countries.
The latest available data.
Source
: https://data.worldbank.org/topic/health Table 3 summarizes the trends in life expectancy and other selected indicators of demand for primary
health care in OIC member countries. Life expectancy at birth, has steadily increased for OIC countries
over the period reported i
n Table 3 .While life expectancy for females has been consistently higher vis-
à-vis corresponding figures for males in OIC countries, trends within each group suggest that both
female and male life expectancy has indeed improved over the years. The current status in OIC
countries as reflected in the figures for 2011-2015 compare well with those for low income countries
(average of 64.3 years for females and 60.7 for males in 2015) and are on par with lower middle-
income countries (average of 69.5 years for females and 65.8 for males in 2015).