
Reducing Postharvest Losses
In the OIC Member Countries
60
such as stems and grains can be used for feed; stems, husks and cobs for fuel. The percentage
of final product lost by weight in the postharvest value chain for Cereals is presented i
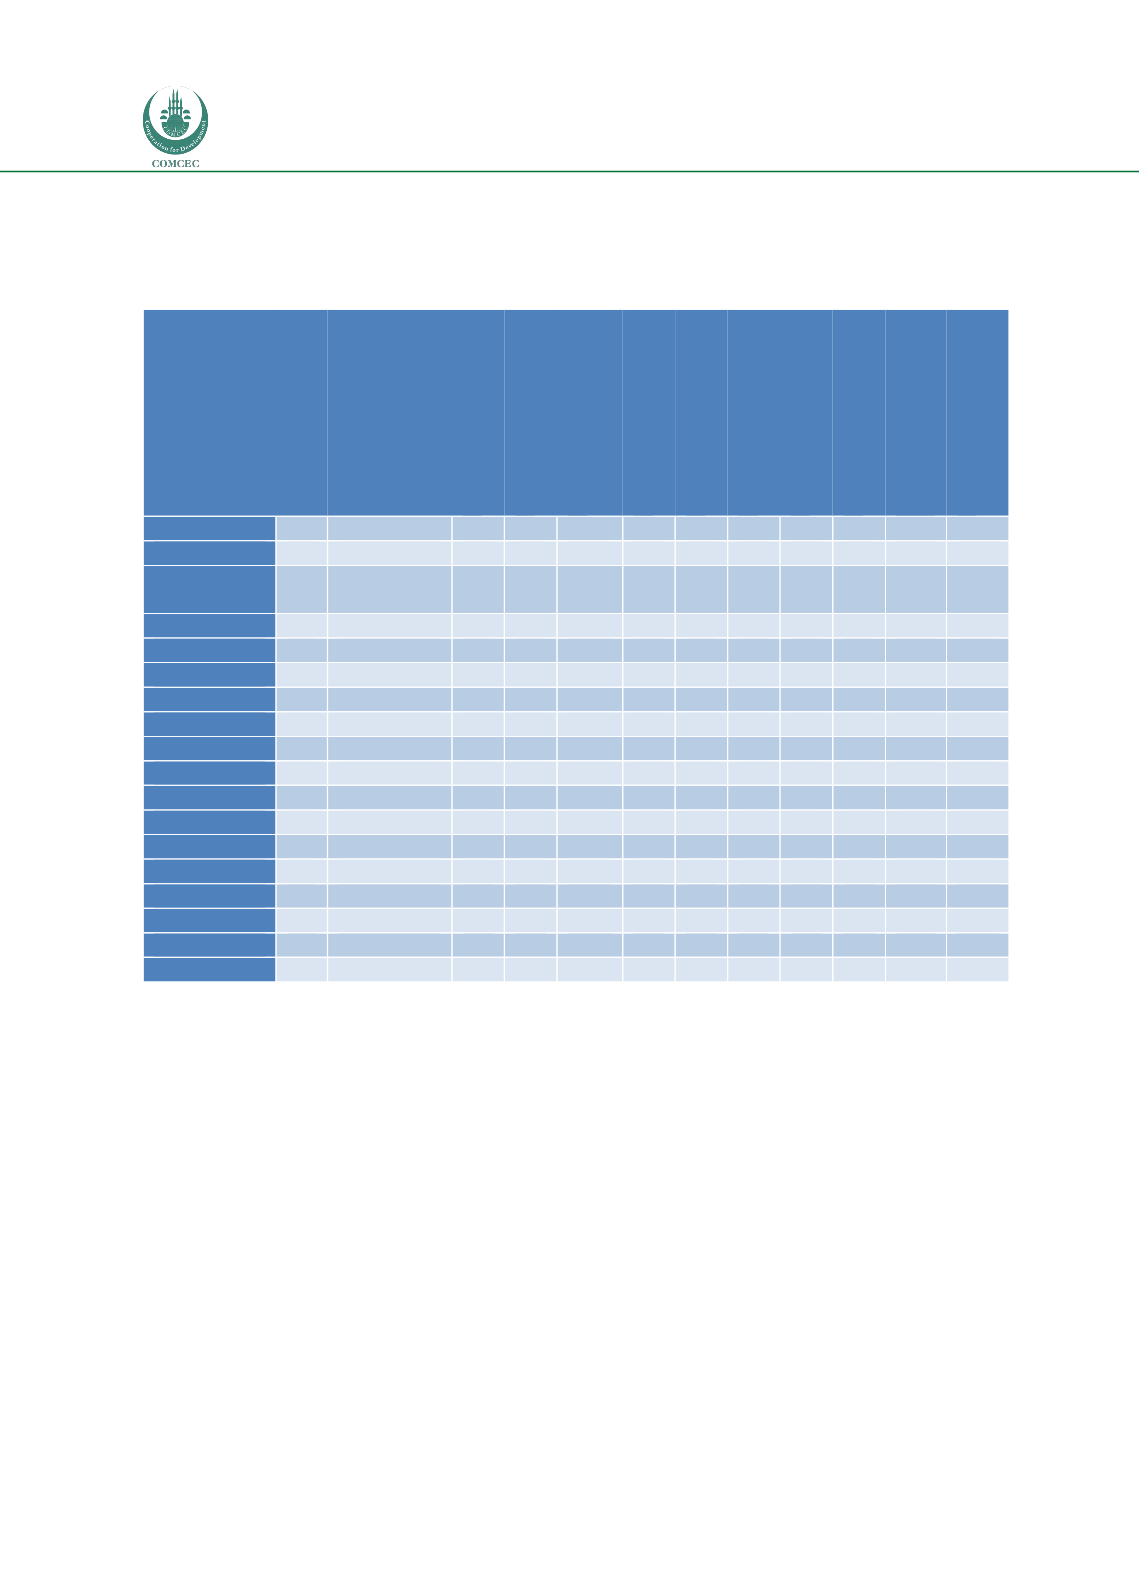
n Table .Table 21: Weight of postharvest losses in cereals per country and step of postharvest value
chai
n
Cereal/
Country
No. Postharvest
losses (%)
(min-max)
Harvesting
Field drying
Transport
Further drying
Threshing/ shelling
Sorting/ grading
Storage
Marketing
Secondary processing
(e.g. milling, oil extraction)
Utilisation/ consumption
MAIZE
14
21 (6-40)
7
11
2
3
5
3
11
3
3
9
Benin
1
15
2
1
5
5
2
Burkina
Faso
3
11
4
0
1
1
1
6
0
4
0
Mozambique
2
30
9
9
3
6
9
4
20
3
2
1
Nigeria
3
35
12
18
4
8
10
14
5
7
29
Togo
1
10
10
Uganda
4
16.5
4
2
1
2
2
1
8
3
2
0
RICE
5
21 (12-35)
5
1
2
3
4
2
2
1
3
1
Bangladesh
2
12
1
1
1
1
2
1
3
1
3
1
Cameroon
1
-
Indonesia
1
15
3
2
3
3
1
1
2
Sierra Leone
1
35
10
5
4
7
3
2
4
SORGHUM
2
10 (no range)
4
0
1
1
1
3
1
0
Mali
1
10
4
0
1
1
1
3
1
0
Senegal
1
-
WHEAT
1
20 (no range)
7
1
2
2
1
1
1
Afghanistan
1
20
7
1
2
2
1
1
1
Grand Total
23
21 (6-40)
6
8
2
3
4
3
9
2
3
7
On average losses in cereals were 21% and ranged from 6 to 40%. Global losses reported on
maize, wheat, and rice were of the same order but losses were lower with sorghum but there
were only one respondent for sorghum and wheat and therefore interpretations of the results
have to be made with caution. Field drying and storage were the stages where the most losses
occur with maize. With rice harvesting and threshing/shelling were critical stages. Most
respondents gave figures for maize (15) and the least for sorghum (1). A common trend was
that losses were estimated to be highest during harvesting for all crops and for maize losses
were also high during field drying and storage. Causes of PHLs were reported for cereals per
step of the value chain (Table 22).


