
Reducing Postharvest Losses
In the OIC Member Countries
65
Postharvest step Maize
Rice
Sorghum
Other
-
Lack of resources to
acquire improved
parboiling
equipment
-
In spite of the mitigation strategies, there are still a number of constraints that can explain the
high postharvest losses encountered with cereals. High cost of processing equipment and
technologies for stakeholders in the value chain of cereals that have a limited capital and
limited understanding of the deterioration factors of the crops (e.g. insect shelf life) are major
constraints to reducing postharvest losses in OIC countries.
3.4.
Roots and Tubers
Respondents (9) selected ‘roots and tubers’ as a commodity they have experience in and
answered questions. Cassava, potato, and sweet potato were the main roots and tubers
reported. Cassava was processed into flour and gari, potato consumed as fresh, and sweet
potato as fresh in Uganda and as sweet potato chips in Indonesia. By-products were animal
feed and peels for cassava, biofuel for potato, and animal feed for sweet potato. The
percentage of final product lost by weight in the postharvest value chain for Roots and tubers
is presented i
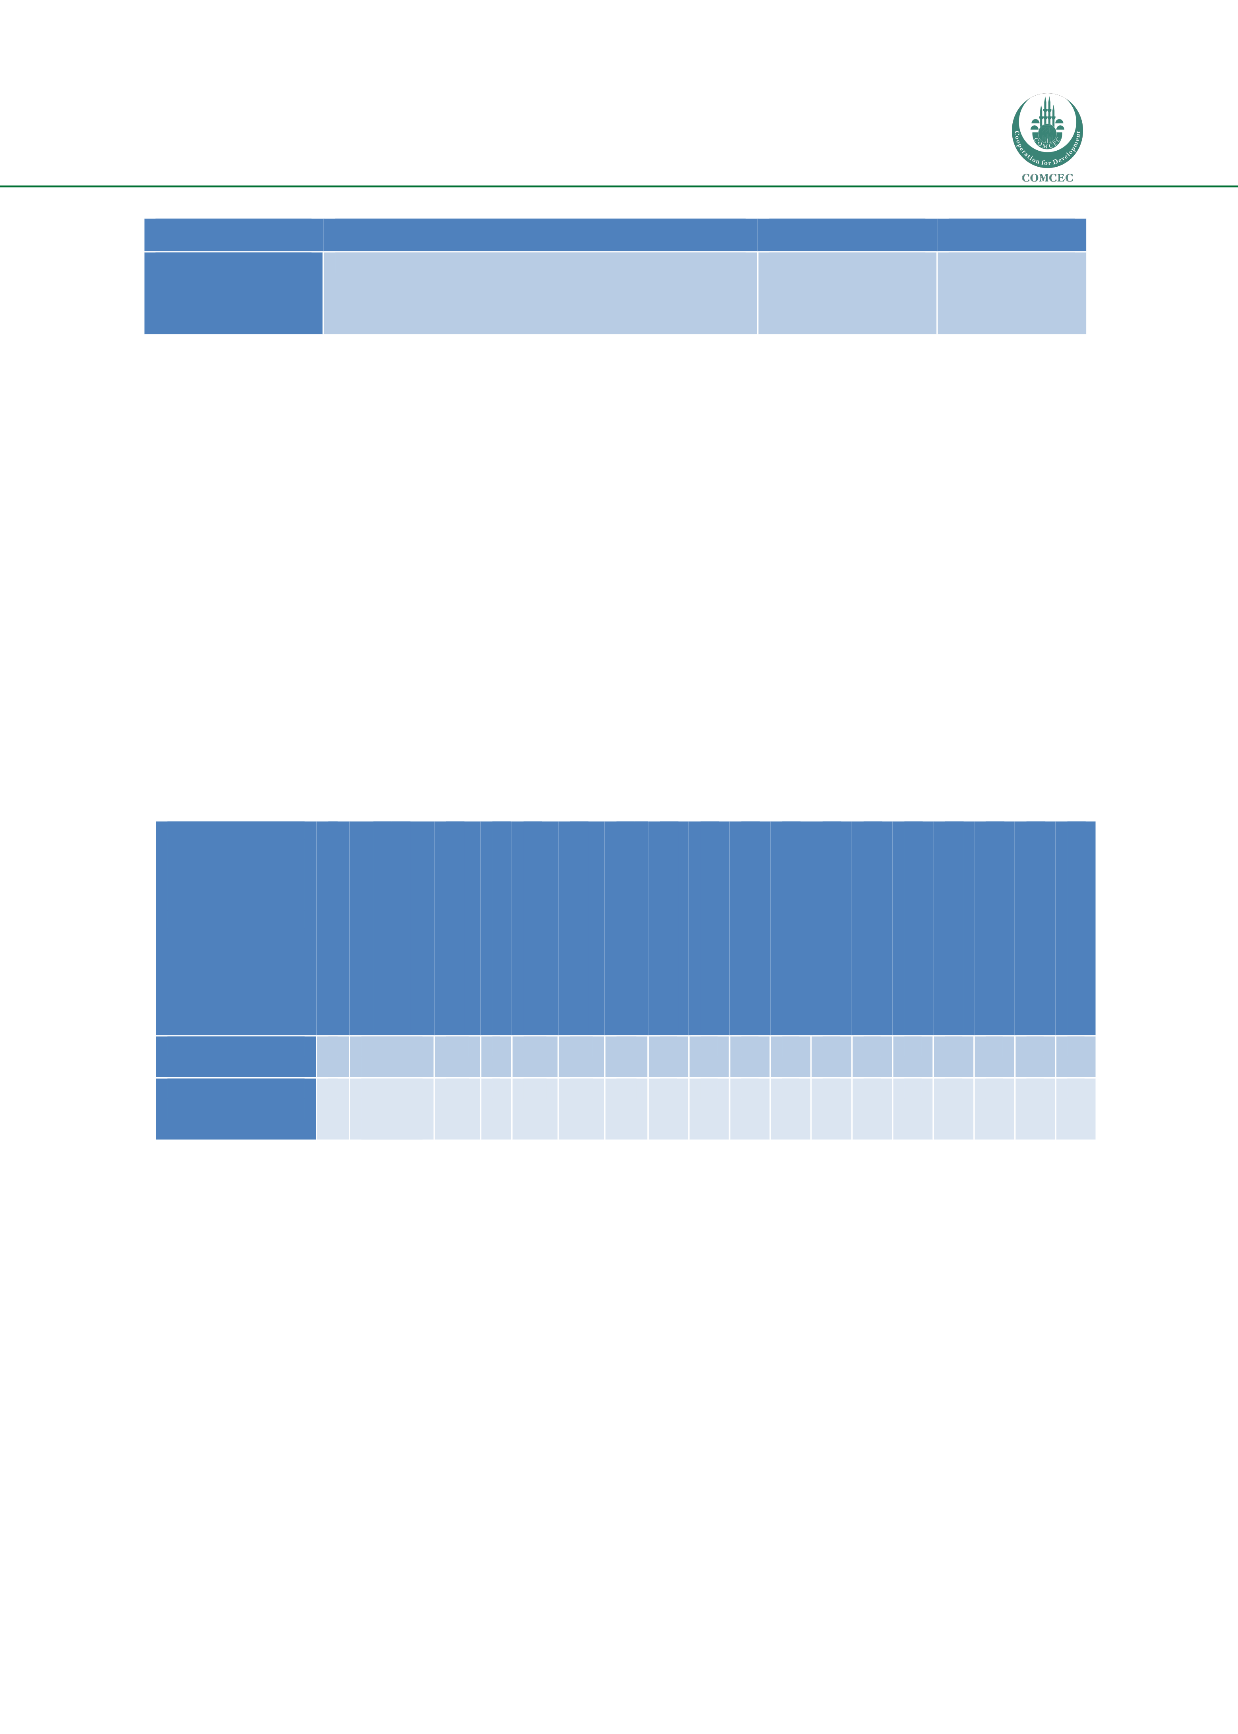
n Table.Table 25: Weight of postharvest losses in roots and tubers per country and step of
postharvest value chain
Country
N
Weight loss (%) (min-
max)
Sorting
Transportation
Washing
Peeling
Grating/Rasping/Chipping
/Crushing
Soaking & Fermentation
Dewatering/pressing
Sieving
Pounding/Pulverising
Frying/ arification
Drying
Milling/Grinding
Packaging
Storage
Marketing
Utilisation/Consumption
Cassava/ Nigeria
5
26
(12-40)
2
1
12
2
1
2
1
2
1
2
1
1
2
3
1
Sweetpotatos/
Uganda
1
20
(no
range)
5
2
1
4
4
4
Note: Number of respondents (N).
Out of 10 respondents, only 6 of them answered the questions on the estimate of PHLs
(Table).
Three respondents did not report figures for losses being Uganda/sweet potato,
Indonesia/sweet potato and Azerbaijan/potatoes. On average losses in roots and tubers were
25% and ranged from 12 to 40%. Global losses reported on cassava and sweet potato were of
slightly lower for sweet potato. Most losses occur during peeling for cassava and during
sorting and consumption for sweet potato. Processing of cassava into flour and gari requires
many steps and small losses that occur at the different steps of the value chain accumulated to
increase the PHL figures. Fresh sweet potato on the other hand did not require extensive
processing since it was sold without processing but losses were reported during storage,
marketing and utilisation.


