


 90 / 213

COMCEC
Reducing Food Waste
In the OIC Member Countries
Food service sectorfood waste
103 food service establishments were surveyed (restaurants, bars, pubs and coffee houses],
with most operating at least 6 days a week.
Respondents noted the main reason for food waste in their establishments was due to customers
leaving leftovers, with less than 15% of customers taking their leftovers home. Half of
respondents felt food waste was generated by preparing too much and they did not think that
store promotions or children had much of an effect on the food waste they generated. Most
establishments have their own food waste collection system and dispose food waste in their
nearest bin.
As with the household respondents most in the sector felt food waste was not a problem as it is
natural and biodegradable, with half agreeing that discarded food packaging had a greater
environmental impact than food waste. Respondents were divided about the importance they
gave to the amount of food waste they throw away, but most do try to keep it to the minimum.
Most respondents stated they could reduce their food waste if they knew how to better store or
purchase food, or they knew more about the environmental impact associated with food waste.
Most felt that training, a national campaign and a co-ordinated food waste collection system by
the authorities would help to reduce food waste. They also agreed that solutions such as being
able to take leftovers home, using smaller buffet servings or reducing portions would help to
reduce food waste.
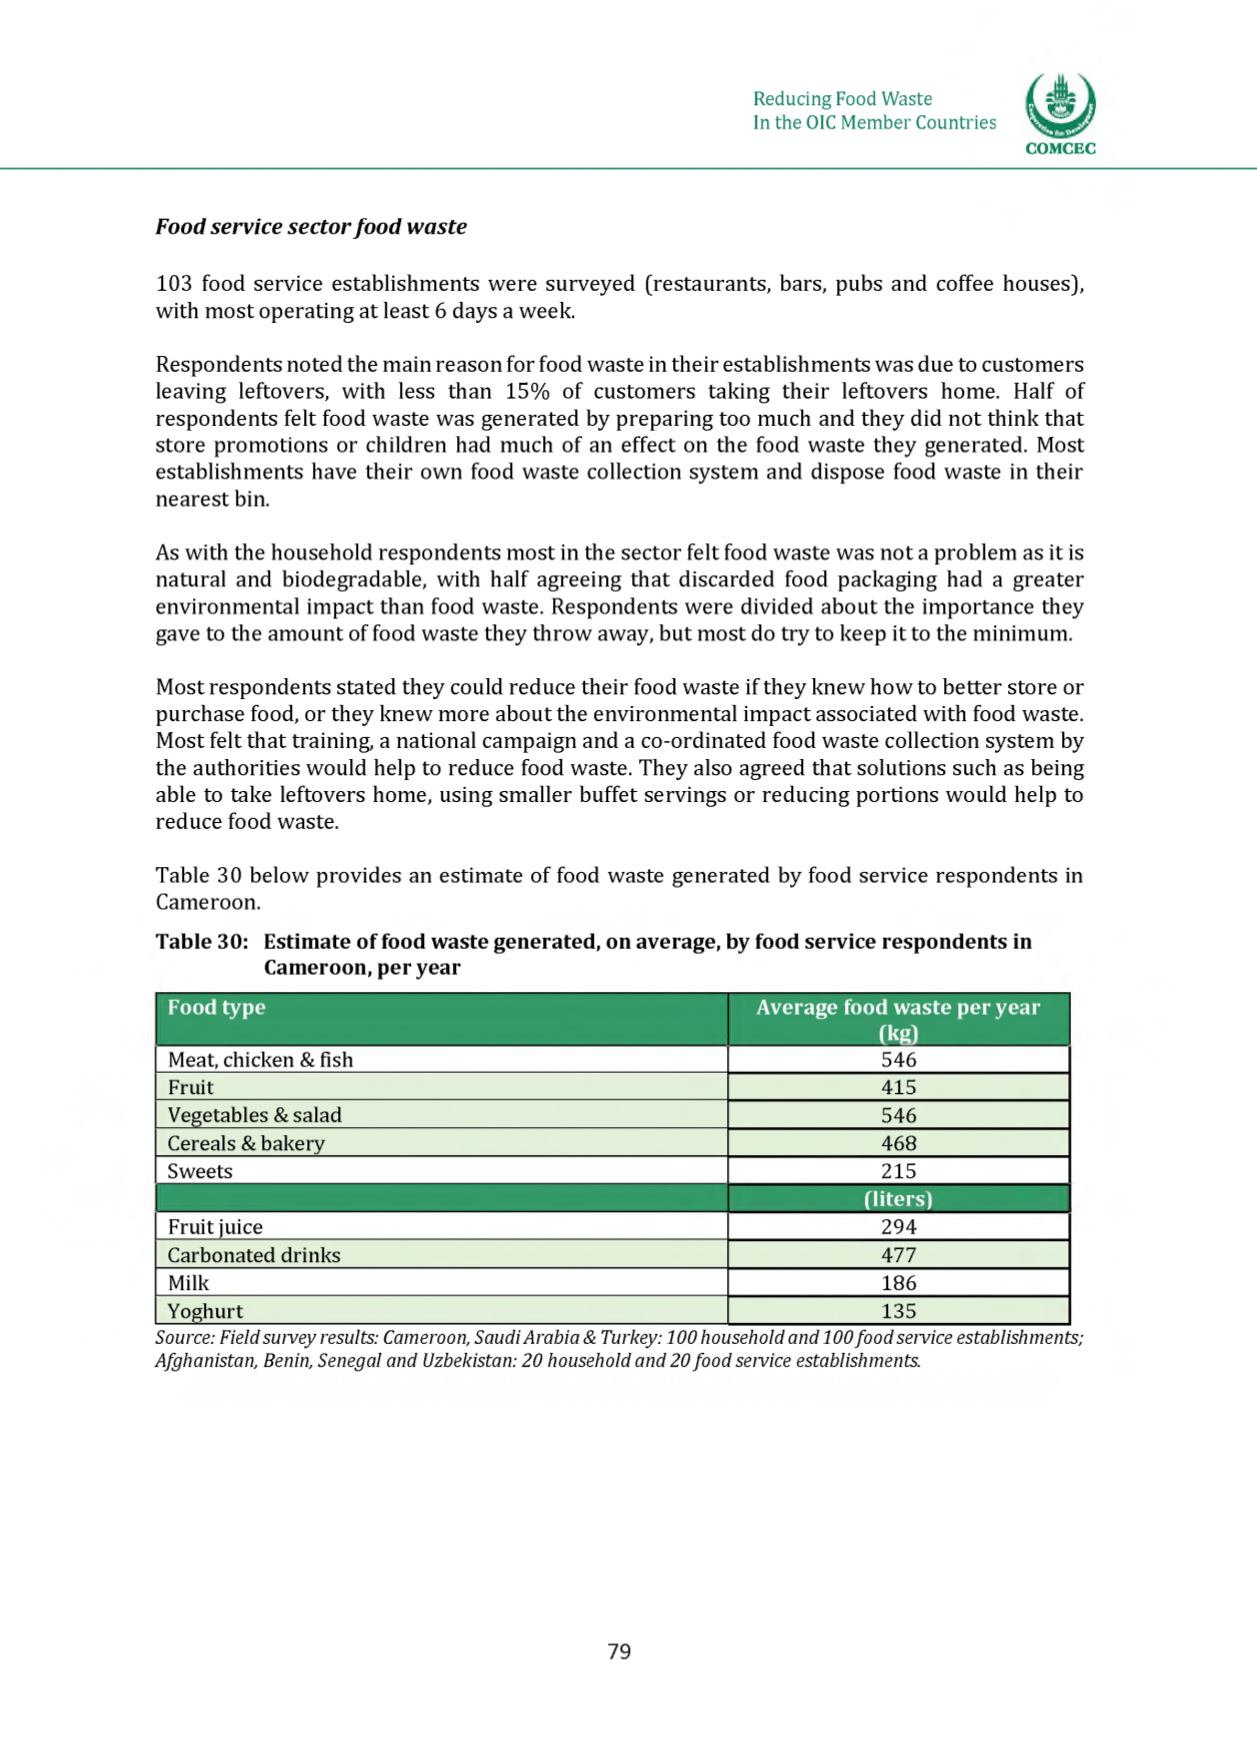
Table 30 below provides an estimate of food waste generated by food service respondents in
Cameroon.
Table 30: Estimate of food waste generated, on average, by food service respondents in
Cameroon, per year
Food type
Average food waste per year
(kg)
Meat, chicken & fish
546
Fruit
415
Vegetables &salad
546
Cereals &bakery
468
Sweets
215
(liters)
Fruit juice
294
Carbonated drinks
477
Milk
186
Yoghurt
135
Source: Field survey results: Cameroon, SaudiArabia & Turkey: 100 household and 100food service establishments;
Afghanistan, Benin, Senegal and Uzbekistan: 20 household and 20 food service establishments.
79