


 57 / 102

Increasing Agricultural Productivity:
Encouraging Foreign Direct Investments in the COMCEC Region
47
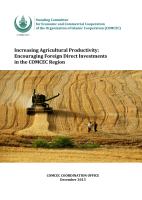
Figure 19: Number of Agricultural FDI projects by year and industry
Source: fDi Intelligence from The Financial Times Ltd
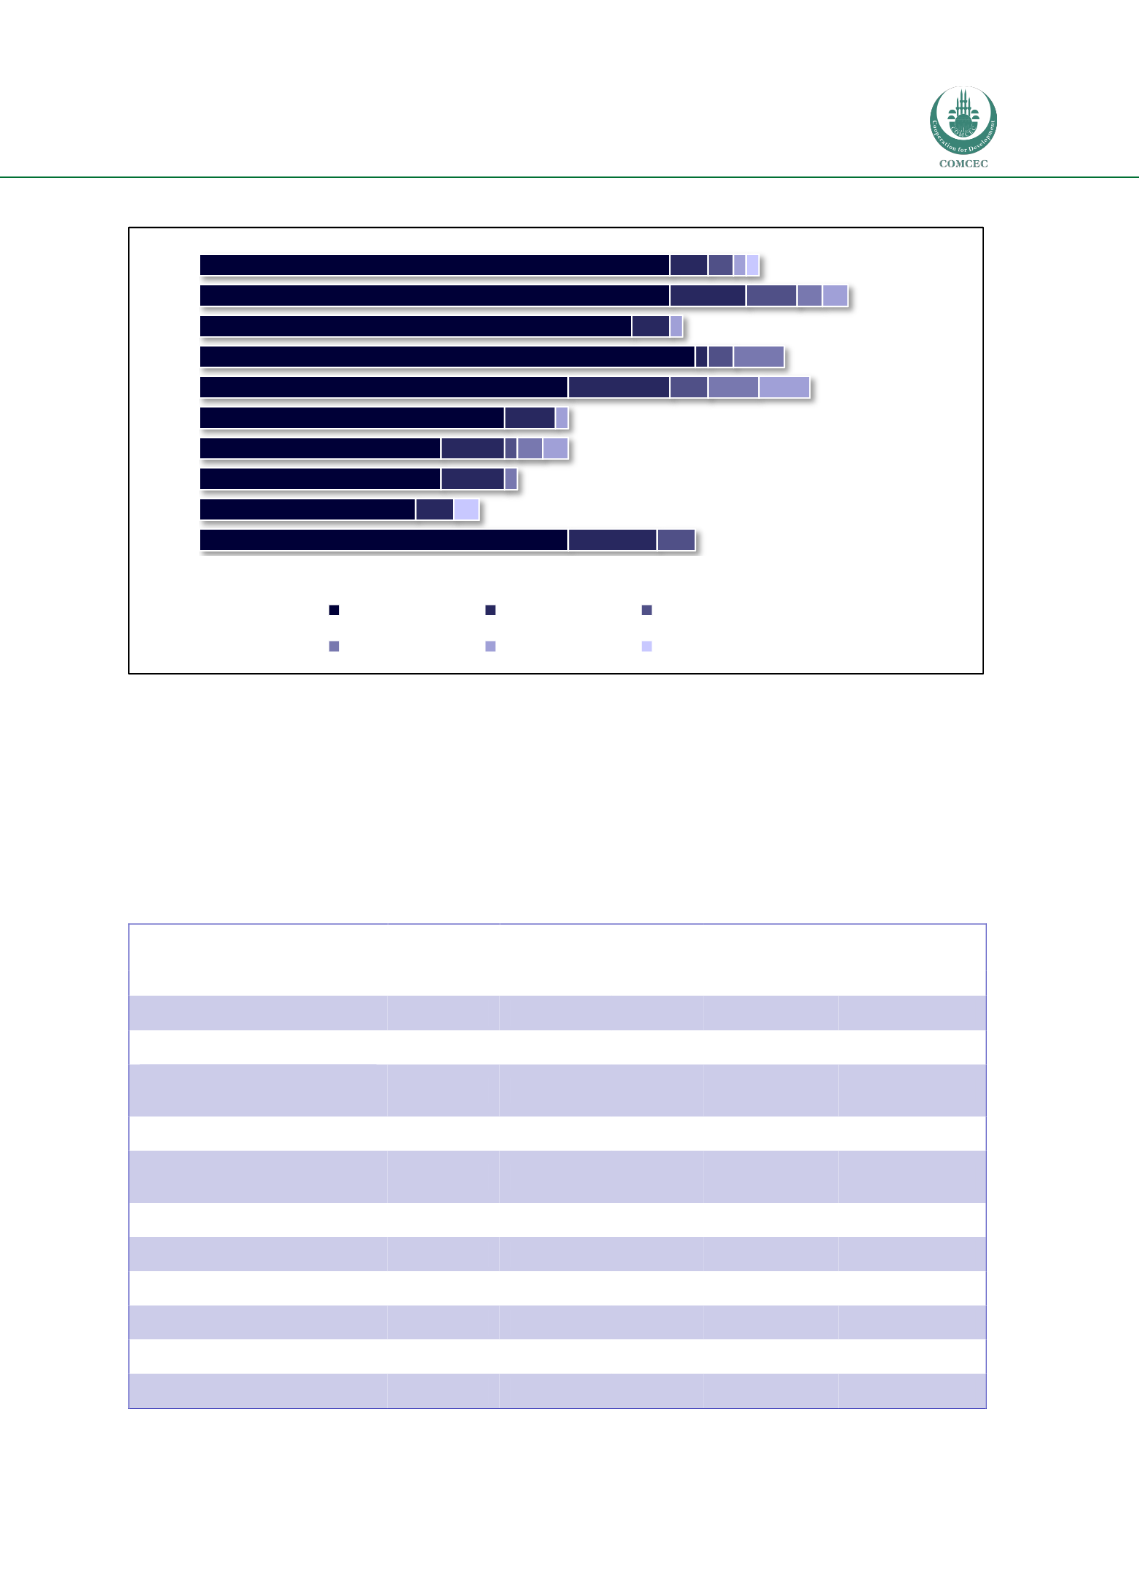
It is also interesting to assess how each sub-sector contributes to economic development
objectives. Table 19 shows that the sub-sector sugar & confectionary products has generated the
highest number of FDI project (i.e. 53 projects). Pesticides, fertilisers & other agricultural
chemicals shows the highest number of job creation (i.e. 20,469 jobs) as well as the highest
capital investment (USD 28.3) billion investment.
Table 19 Agricultural FDI trends in the COMCEC Region by Sub-sectors
Sub-Sectors
No of
projects
Jobs Created
Capital investment
Total
Average
Total (USD m)
Average (USD m)
Sugar & confectionary products
53
4,106.1
77.5
17,153
323
Grains & oilseed
48
2,461.6
51.3
11,229
233
Pesticide, fertilisers & other
agricultural chemicals
45
20,469.0
454.9
28,266
628
Dairy products
45
1,730.1
38.4
7,342
163
Fruits & vegetables & specialist
foods
32
1,143.9
35.7
5,099
159
Crop production
26
6,657.7
256.1
13,087
503
Tobacco
17
704.8
41.5
4,634
272
Other rubber products
15
2,230.0
148.7
10,637
709
Seafood products
14
1,363.1
97.4
1,926
137
Coffee & tea
14
453.1
32.4
1,780
127
Animal slaughtering & processing
11
988.9
89.9
4,534
412
29
17
19
19
24
29
39
34
37
37
7
3
5
5
4
8
1
3
6
3
3
1
3
2
4
2
1
2
4
4
2
2
1
4
1
2
1
2
1
2003
2004
2005
2006
2007
2008
2009
2010
2011
2012
Food & Tobacco Chemicals
Rubber
Wood Products Pharmaceuticals Other sectors