


 54 / 102

Increasing Agricultural Productivity:
Encouraging Foreign Direct Investments in the COMCEC Region
44
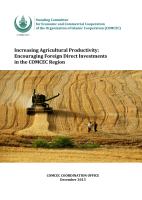
Figure 16: Top Location Determinants: Percentage of Projects Citing Investment Motive
Source: fDi Intelligence from The Financial Times Ltd, Sample: 58 projects.
3.1.4
Firm level FDI assessment
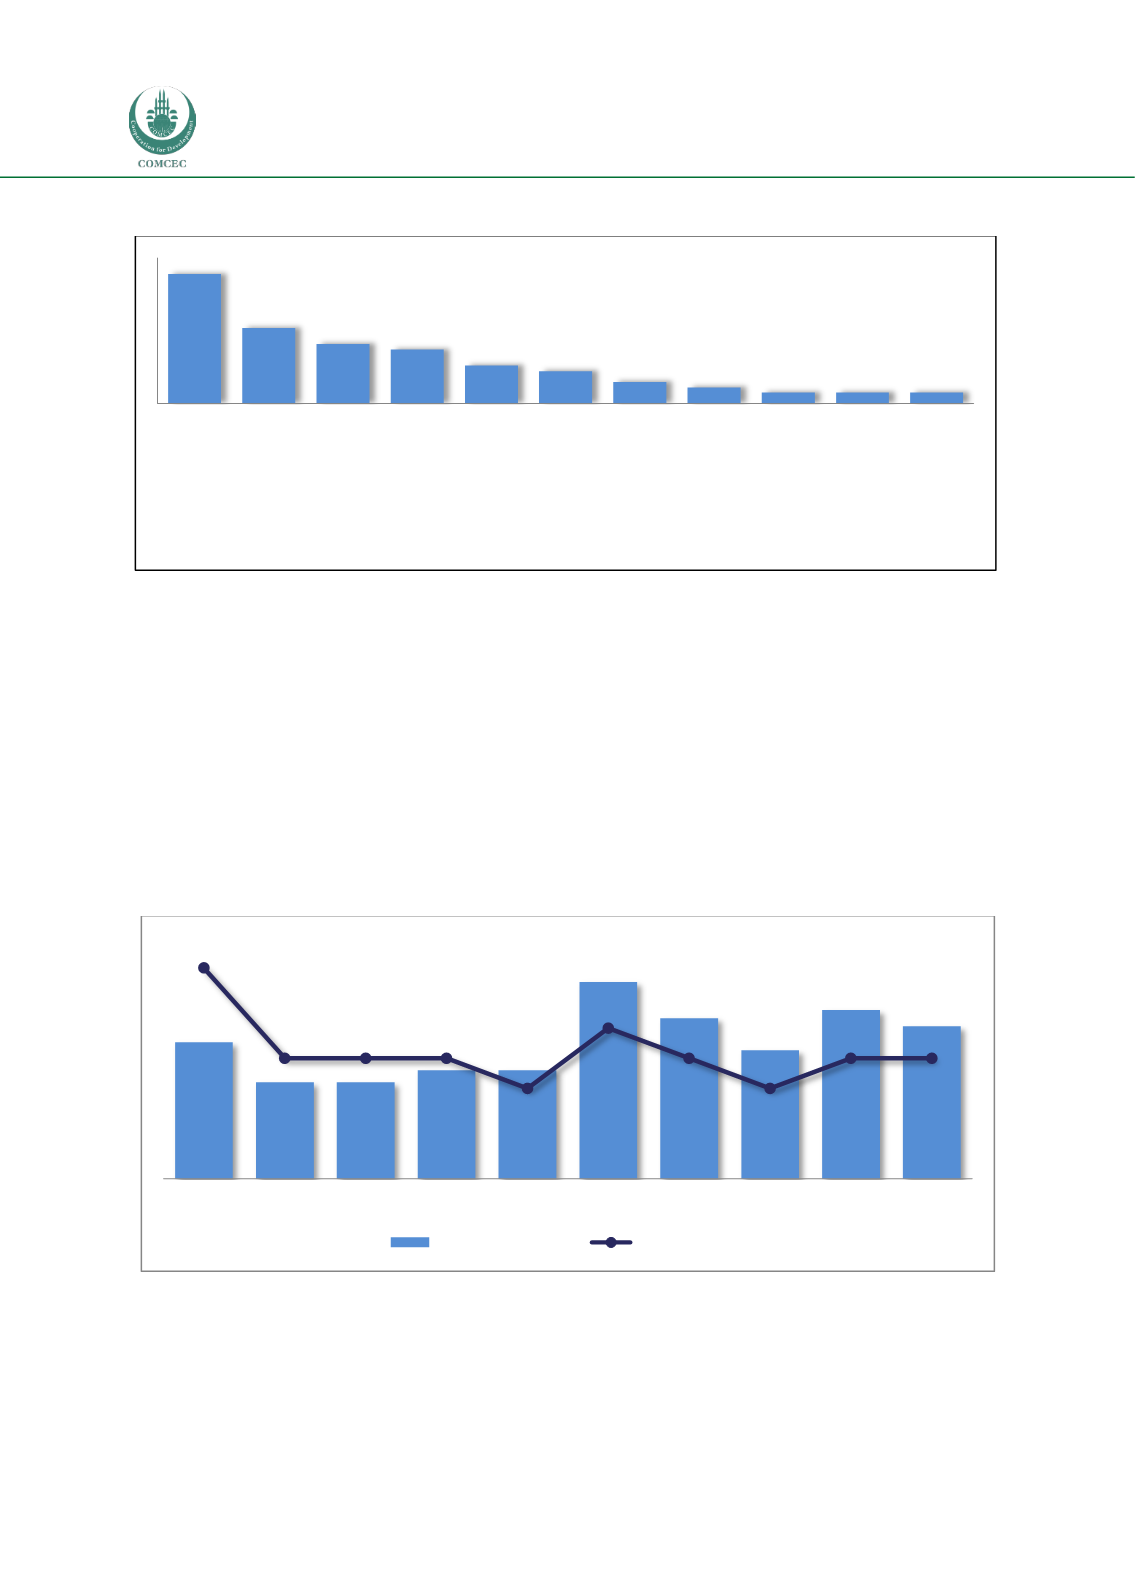
At firm level, a total of 244 companies out of a total 41,869 companies investing in FDI globally,
engaged in agricultural FDI in the COMCEC Region. Given the global count, this number seems
insignificant at first sight. Yet, these companies account for more than 115,000 new jobs and
more than $46 billion in investment. Figure 17 shows the number of companies engaging in
agricultural FDI per year, as well as the percentage of the total sample of companies engaging in
FDI.
Figure 17: Number of Companies by Year and Percentage of all Companies in the COMCEC
Member Countries (2003-2012)
Source: fDi Intelligence from The Financial Times Ltd
As illustrated in Table 17, the top 10 companies accounted for a combined total of 80 projects
(20 percent of projects). Within the past 12 months, four of the top 10 companies have
announced projects, with Olam International being the top investor for this period, with three
44,4
25,9
20,4
18,5
13
11,1
7,4
5,5
3,7
3,7
3,7
Domestic Market
Growth Potential
Regulations or
business climate
Natural
Resources
Proximity to
markets or
customers
Infrastructure
and logistics
Lower Costs
Skilled workforce
availability
Presence of
Suppliers or JV
Partners
IPA or Govt
support
Finance
Incentives or
Taxes or Funding
Other Motive
34
24
24
27
27
49
40
32
42
38
0,7%
0,4%
0,4%
0,4%
0,3%
0,5%
0,4%
0,3%
0,4%
0,4%
2003 2004 2005 2006 2007 2008 2009 2010 2011 2012
No of Companies
% of Companies