
Increasing Agricultural Productivity:
Encouraging Foreign Direct Investments in the COMCEC Region
46
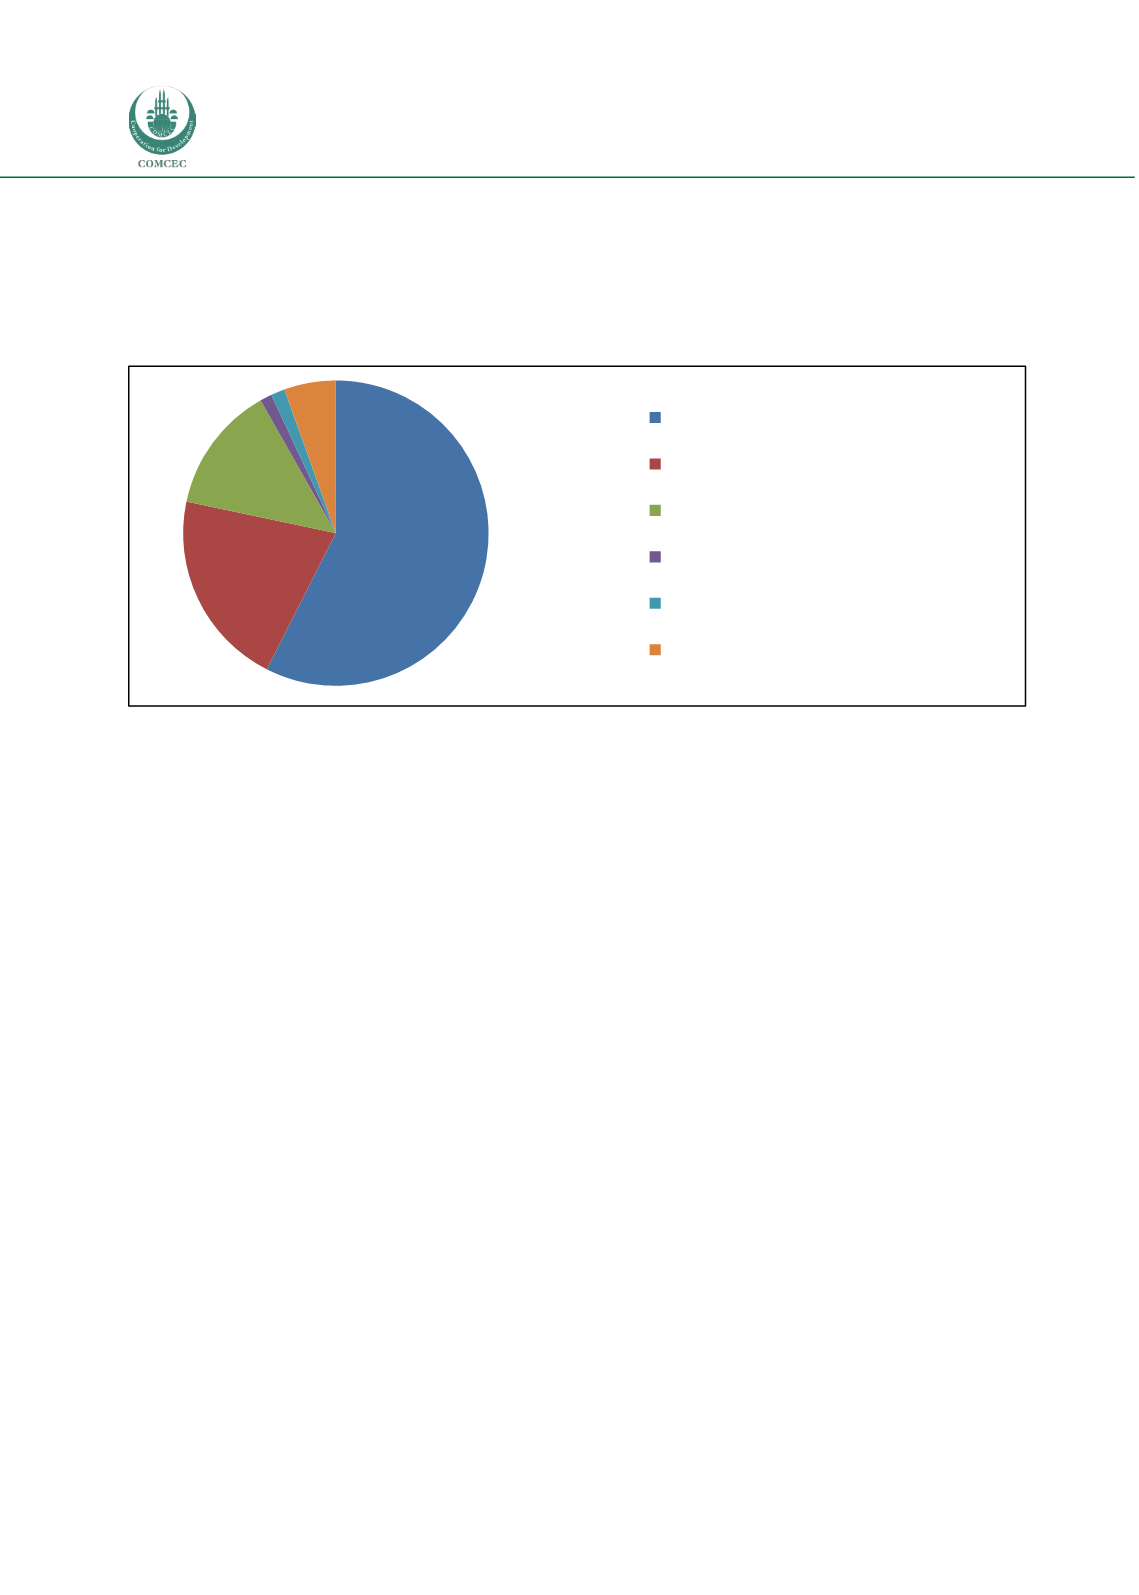
In terms of company size, the majority of companies have an annual turnover of USD 5.00 billion
or higher (in 160 out of 371 FDI projects), while 58 FDI projects were conducted by companies
with a turnover between 1 and 4.99 billion. As illustrated in Figure 18, smaller companies, up to
49.9 million of annual turnover, account for 19 projects or 5 percent of the total sample.
Figure 18: Size of Companies by Turnover by Number of Agricultural FDI Projects
Source: fDi Intelligence from The Financial Times Ltd
This kind of information is critical when defining an investor targeting profile and executing an
investor lead generation strategy. It provides further insights in how to prioritize agricultural
investors and justifies why limited resources and personal attention is disproportionally more
allocated towards the global players at the expense of smaller companies.
3.1.5
Industry and Sub-sector Analysis at Category of Agricultural Activity Level
Figure 19 shows that although a total of 24 sub-industries were included in this analysis, Food &
Tobacco came out as the dominant industry accounting for 80 percent of projects tracked in
2012. Project volume in this sector peaked in 2011 and 2012, with 37 projects tracked. This
industry is followed by Agricultural Chemical and Rubber products.
160
58
38
44
15
USD 5.00 bn or higher
USD 1.00 bn to 4.99 bn
USD 100.00 m to USD 999.99 m
USD 50.00 m to USD 99.99 m
USD 25.00 m to USD 49.99 m
USD 24.99 m or less


