


 37 / 272

Reviewing Agricultural Trade Policies
To Promote Intra-OIC Agricultural Trade
25
periods considered. For ASEAN cereals moved to the 6th place. For OIC crude rubber seems to
use its 5th place to the benefit of cereals.
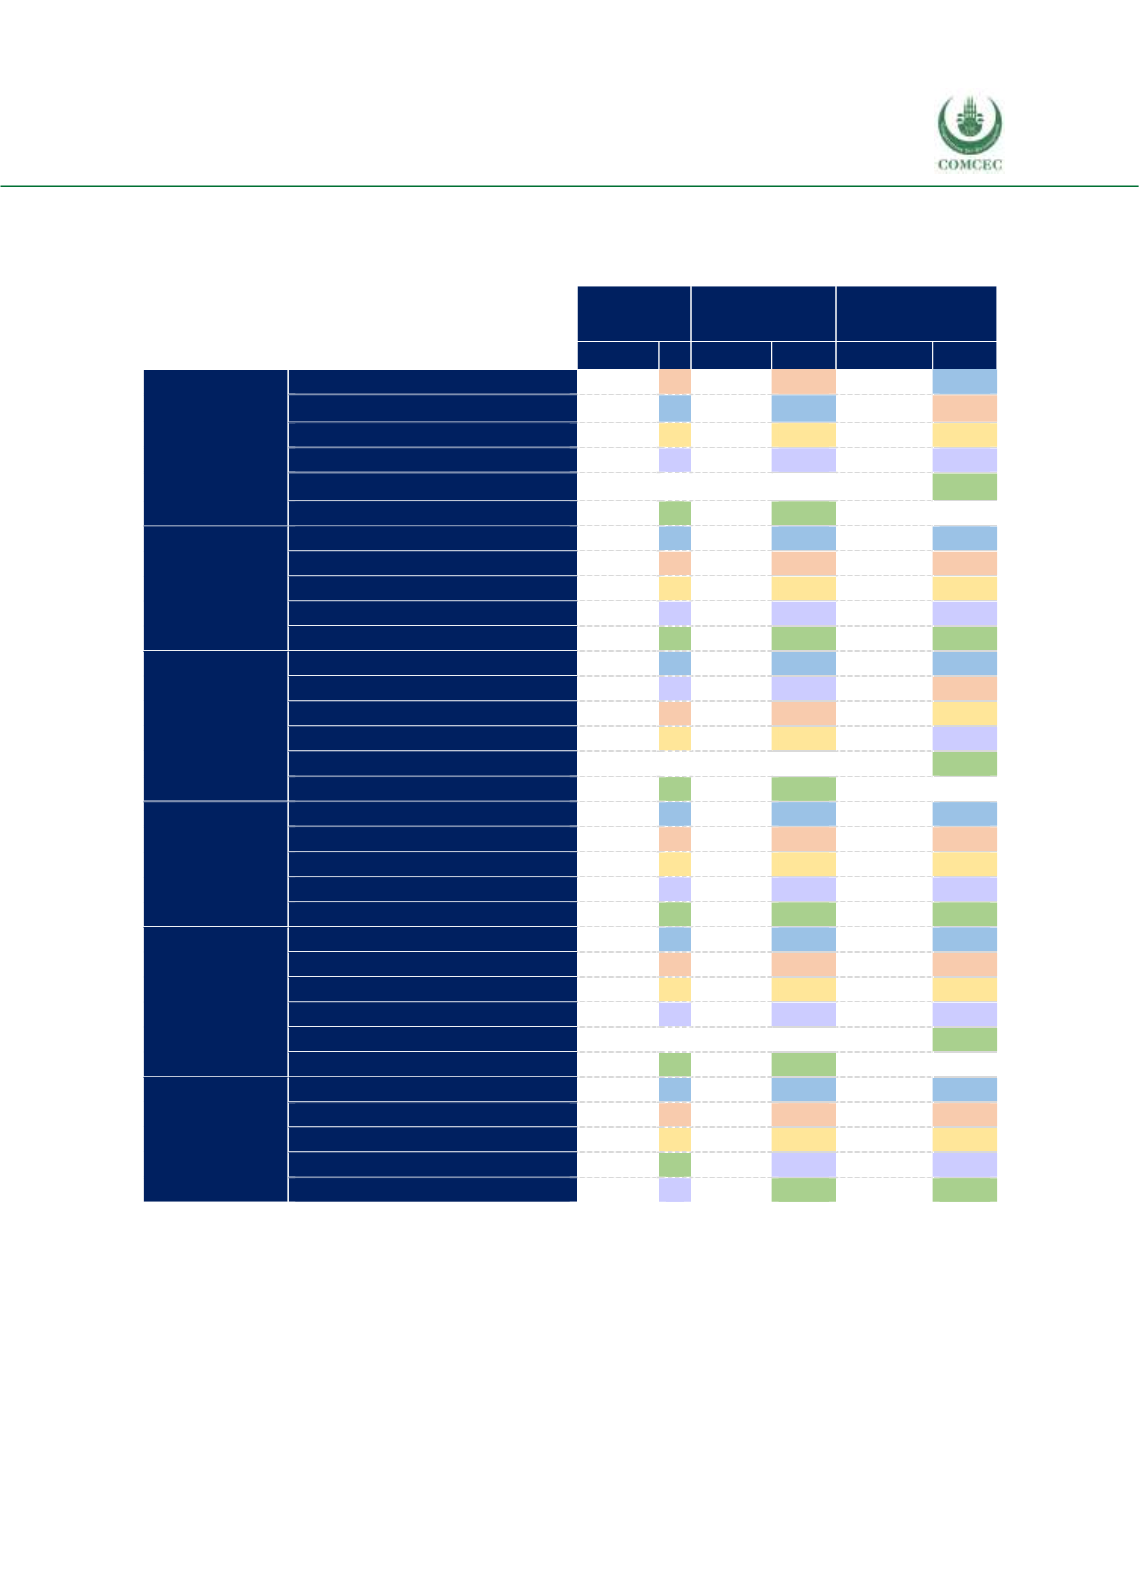
Table 2. 2 Top 5 Export Products of Major Trade Blocs
2016
2014-2016
Average
2008-2016
Average
Share # Share
#
Share
#
NAFTA
Cereals
14.7
2
15.6
2
17.6
1
Vegetables, fruit
18.9
1
17.9
1
16.3
2
Oil-seeds
13.2
3
12.6
3
12.6
3
Meat
9.7
4
9.8
4
9.8
4
Feeding stuff for animals
5.9
6
6.4
6
5.9
5
Cork, wood
6.8
5
6.6
5
5.8
6
MERCOSUR
Oil-seeds
21.2
1
22.5
1
19.7
1
Meat
15.3
2
15.8
2
15.8
2
Feeding stuff for animals
14.7
3
15.4
3
14.3
3
Cereals
11.4
4
10.5
4
10.9
4
Sugars
9.7
5
8.2
5
9.5
5
ASEAN
Oils, fats, waxe
22.7
1
22.9
1
24.5
1
Crude rubber
10.1
4
10.3
4
14.0
2
Fish
12.9
2
13.1
2
13.6
3
Vegetables, fruit
11.5
3
11.1
3
9.3
4
Cereals
7.1
6
7.3
6
8.0
5
Coffee, tea, cocoa, spices
8.6
5
8.4
5
7.6
6
EU-28
Beverages, tobacco
15.4
1
15.2
1
15.3
1
Vegetables, fruit
14.5
2
14.1
2
14.1
2
Meat
10.7
3
10.7
3
11.0
3
Cereals
10.0
4
10.3
4
10.3
4
Dairy
9.1
5
9.7
5
9.9
5
OIC
Oils, fats, waxe
23.6
1
24.2
1
25.5
1
Vegetables, fruit
17.6
2
17.4
2
15.9
2
Coffee, tea, cocoa, spices
11.6
3
11.3
3
10.9
3
Fish
8.8
4
8.3
4
8.0
4
Crude rubber
4.6
7
5.1
6
7.9
5
Cereals
7.6
5
7.4
5
7.2
6
World
Vegetables, fruit
16.2
1
15.5
1
14.6
1
Cereals
10.4
2
10.9
2
11.4
2
Beverages, tobacco
9.5
3
9.3
3
9.3
3
Meat
8.8
5
8.9
4
8.9
4
Fish
8.9
4
8.6
5
8.3
5
Source: ITC Macmap, CEPII BACI, Eurostat RAMON, UN Comtrade, UN Trade Statistics, and authors’
calculations.
Note: Colors represent the rankings. For OIC, NAFTA and ASEAN, 2016 ranking differs from the 2008-16
average and more than 5 product divisions appear in the table.