


 139 / 272

Reviewing Agricultural Trade Policies
To Promote Intra-OIC Agricultural Trade
127
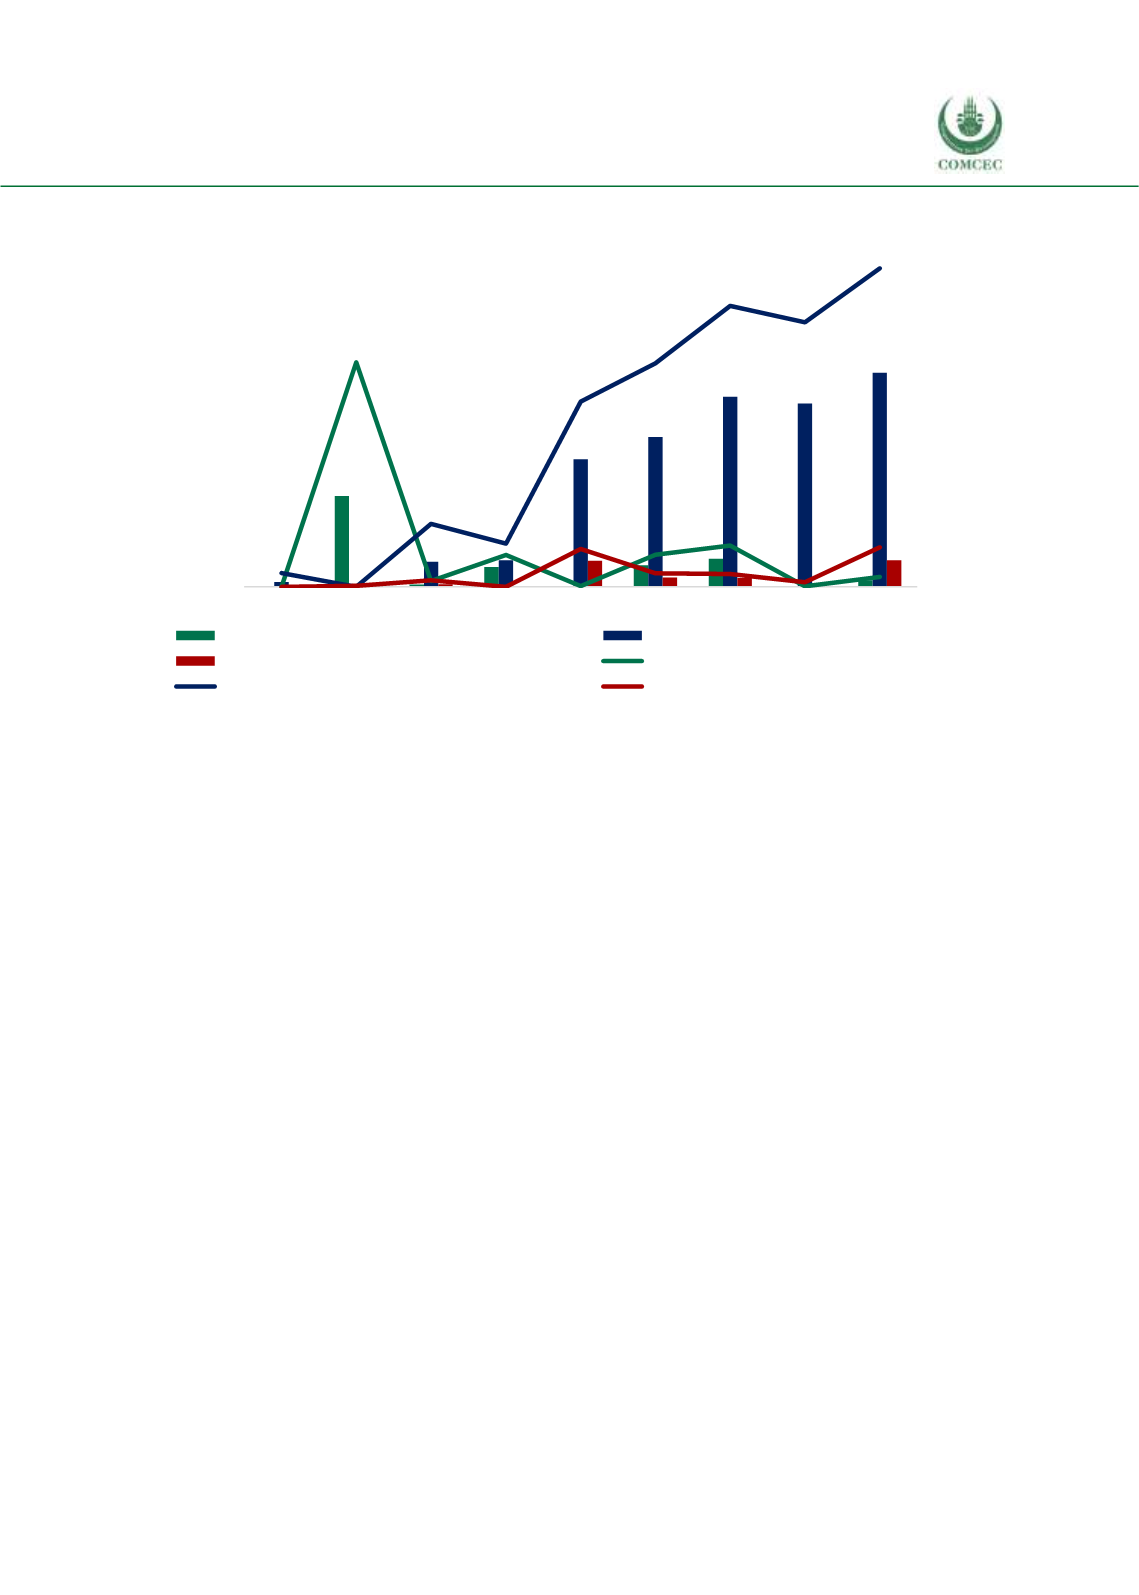
Figure 4. 41 Share of OIC Groups in Chad’s Agricultural Exports
Source: CEPII BACI, Eurostat RAMON, UN Comtrade, UN Trade Statistics, and authors’ calculations
Figure 4.42 presents the share of OIC groups in Chad’s agricultural imports. The share of the
Asian group has increased from 3.1% to 11.2% during the 2008-2016 period, while the share of
the Arab group has increased from 3.9% to 6.2%. The share of the African group has decreased
from 32.1% in 2008 to 3.8% in 2012, which possibly stemmed from the political instability of
Chad’s trade partners in the region. Imports from Africa have recovered from the decrease in
2012 with an increase to 30.5% in 2015, but decreased to 9.7% afterwards, again reflecting
Chad’s poor economic performance in 2016.
General overview
The OIC countries account for nearly all of Chad’s agri-food exports, and the Asian group has the
largest share in total exports with 96.3%. As of 2016, the value of Chad’s agricultural exports to
the Asian group is 22.6 million USD. The value and shares of the African and Arab groups’ agri-
food exports are very small, despite the African group’s relative importance for Chad’s agri-food
exports before 2012 (See Figure 4.43).
Agri-food imports are the primary source of Chad’s agricultural imports, and the OIC countries
are a significant provider of agri-food products to Chadwith a share of 30.1%. Figure 4.44 shows
that the share of the OIC countries increased from 38.2% in 2008 to 40.3% in 2015, but declined
because of the sharp decrease in imports from the African group in 2016. The Asian group is
becoming a significant agri-food import source for Chad, with its share increasing from 2.7% in
2008 to 13.6% in 2016. The corresponding increase in volume is from 3.4 million USD to 11.2
million USD (229% increase). The Arab group’s share increased from 3% in 2008 to 6.6% in
2016.
0
4
8
12
16
20
24
28
32
36
40
0
5
10
15
20
25
30
35
40
45
50
2008 2009 2010 2011 2012 2013 2014 2015 2016
African Group (million USD)
Asian Group (million USD)
Arab Group (million USD)
African share in total agricultural exp. (%)
Asian share in total agricultural exp. (%)
Arab share in total agricultural exp. (%)
million USD
%