
Reviewing Agricultural Trade Policies
To Promote Intra-OIC Agricultural Trade
126
Trade policies in Chad in terms of preferential trade agreements have been influenced by
Economic and Monetary Community of Central Africa (CEMAC). Most of the free trade
agreements are developed in parallel to this trade bloc. Currently, Chad is part of free trade
agreements with 5 countries worldwide including 2 OIC member countries (Cameroon and
Gabon) (WTO, RTA-IS).
4.4.1. Agricultural Trade with the OIC Countries
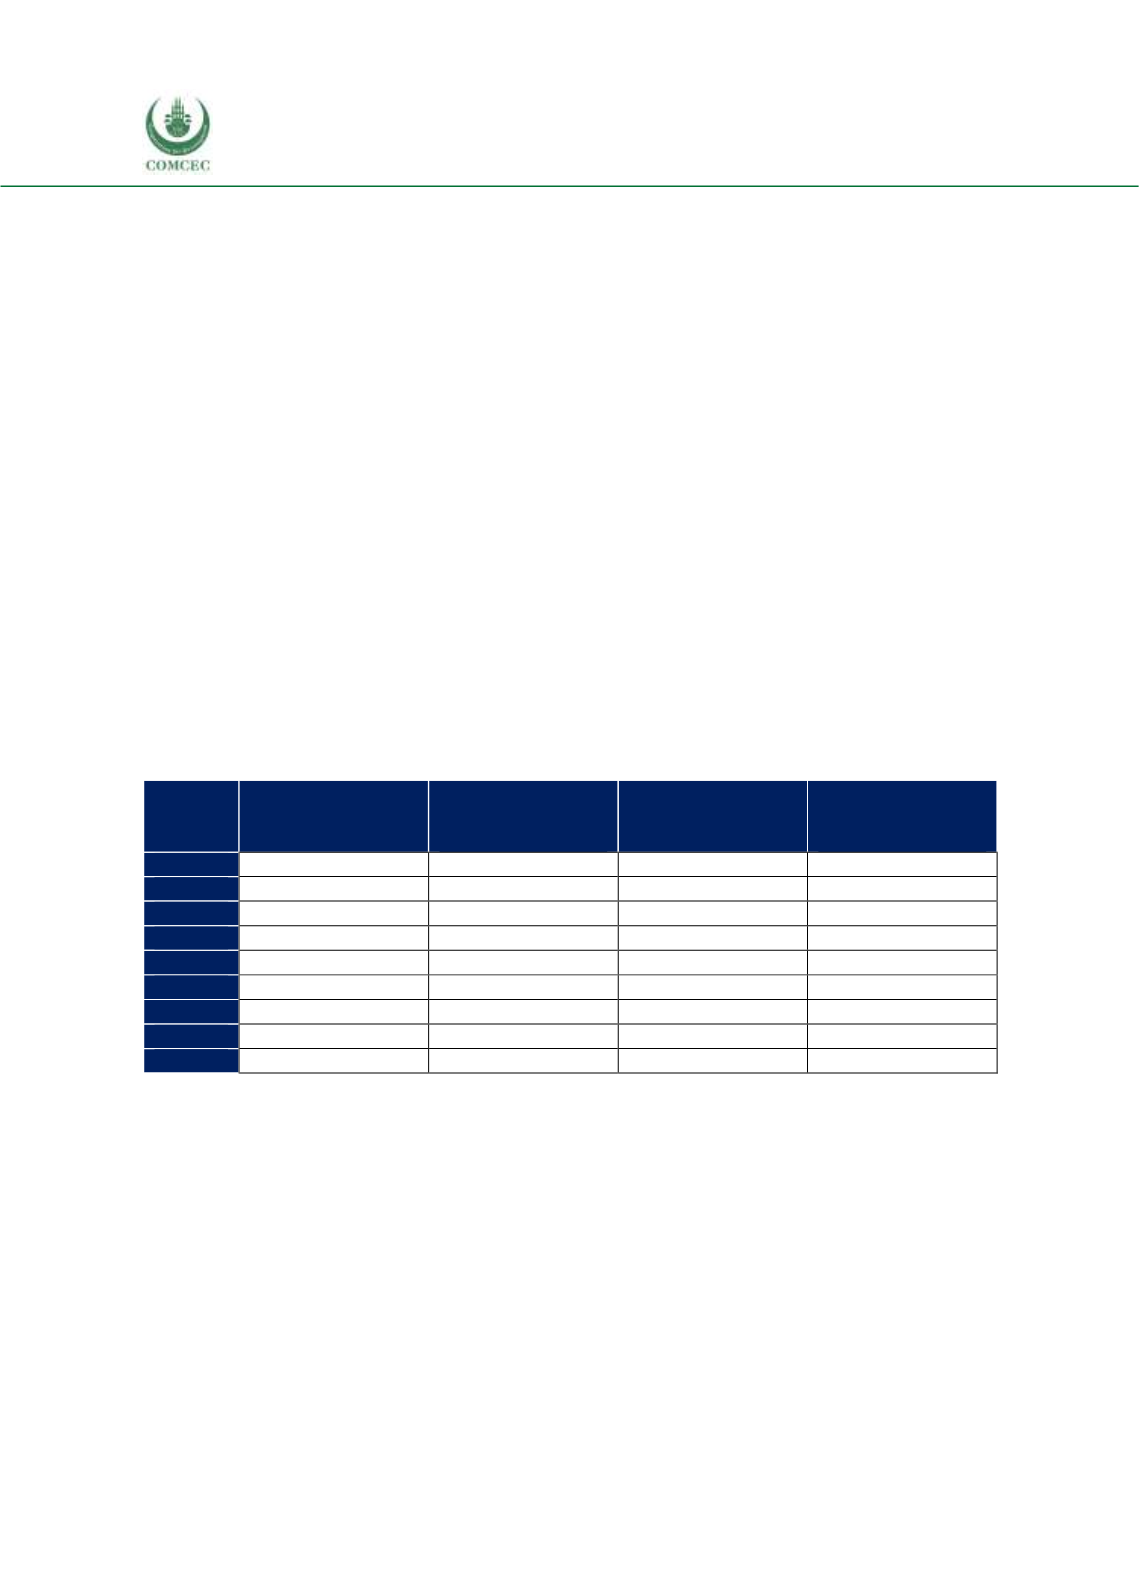
Table 4.38 shows that the OIC countries are the largest market for Chad exports as of 2016.
Increasing from a share of 2% in total agricultural exports from 2008 to 53.1% in 2016, exports
to the OIC members account for more than a half of Chad’s agricultural exports. The
corresponding increase in value is from 0.6 million USD to 28.6 million USD respectively from
2008 to 2016. The total value of Chad’s agricultural imports to OIC countries are smaller than
its exports, indicating a trade surplus. The value of Chad’s agricultural imports from OIC
countries has been within a range of 10.4 million USD to 20.9 million USD. Chad’s agricultural
imports from the OIC countries recorded its lowest value of the 2008-2016 period in 2012,
which is possible due to the political instability in Chad’s trade partners in Africa. The share of
Chad’s agricultural imports from the OIC countries increased from 38.3% in 2008 to 41.3% in
2015, but declined to 30.5% in 2016. The reason is the shrinking of the country’s agricultural
imports by around one third due to Chad’s negative growth rate in 2016, which obviously
affected the consumption patterns by reducing its imports while diverting it from OIC to non-
OIC countries.
Table 4. 38 Value & Share of OIC in Chad’s Agricultural Trade
Year
Value (exports)
million USD
Share in Chad’s
total agricultural
exports, %
Value (imports)
million USD
Share in Chad’s
total agricultural
imports, %
2008
0.6
2.0
43.3
38.3
2009
10.5
32.6
37.3
36.3
2010
3.5
10.9
29.5
27.3
2011
5.4
10.8
21.3
20.4
2012
17.8
32.3
11.3
11.5
2013
20.8
38.9
42.8
33.8
2014
26.2
48.4
45.2
34.5
2015
21.6
38.9
51.6
41.3
2016
28.6
53.1
25.4
30.5
Source: CEPII BACI, Eurostat RAMON, UN Comtrade, UN Trade Statistics, and authors’ calculations
Figure 4.41 presents the share of OIC groups in Chad’s agricultural exports. The Asian group has
become a significant market for Chad’s agricultural exports, increasing from 2% in 2008 to 46%
in 2016. As of 2016, the Asian group accounts for nearly half of Chad’s agricultural exports with
a value of 27.8 million USD. The shares of the African and Arab groups have remained below 6%
each during the observation period, except for the African group’s share of 32.4% in 2009. The
unusually high share is probably the outcome of the global crisis in 2009.


