


 136 / 272

Reviewing Agricultural Trade Policies
To Promote Intra-OIC Agricultural Trade
124
4.4. Chad
Chad is a low-income country with a GDP of 10 billion USD and 670 USD GDP per capita in 2017.
Chad ranks 134th in GDP (PPP) and 211th among a total of 230 countries. The average rate of
GDP growth in Chad between 2010 and 2016 has been 4.5%. In 2016, Chad’s GDP growth rate
has been -6.3%, inflation rate has been -1.1%, and unemployment rate has been 5.8%.
Being a landlocked country, Chad is one of Africa’s largest countries with diverse weather
patterns. Agriculture has a vital role for Chad's economy and is the primary source of
maintaining people’s livelihood in the region. Despite its slight decline since 2008, agriculture is
still the largest sector in Chad economy with a share of 49.5% in GDP and a share of 87.2% in
employment. Chad is among the largest oil producers in Africa, and the majority of Chad's export
revenues come from oil products. Chad’s leading agricultural export products are cotton, Arabic
gum, and livestock. As of 2016, agricultural product exports are 3.5% of the countries’ total
exports.
Table 4. 37 Share of Agriculture in GDP, Employment and Trade, Chad
Year
% share in GDP
% share in
employment
% share in
exports
% share in
imports
2008
54.6
87.2
0.8
20.9
2009
46.5
86.6
1.5
14.4
2010
51.9
86.8
1.1
11.6
2011
51.2
86.7
1.4
16.1
2012
54.9
86.6
2.0
15.4
2013
50.0
86.1
1.9
11.3
2014
50.6
85.5
2.1
10.4
2015
50.2
85.9
2.6
15.5
2016
49.5
87.2
3.5
15.4
Source: CEPII BACI, Eurostat RAMON, World Bank, UN Comtrade, UN Trade Statistics, and authors’
calculations
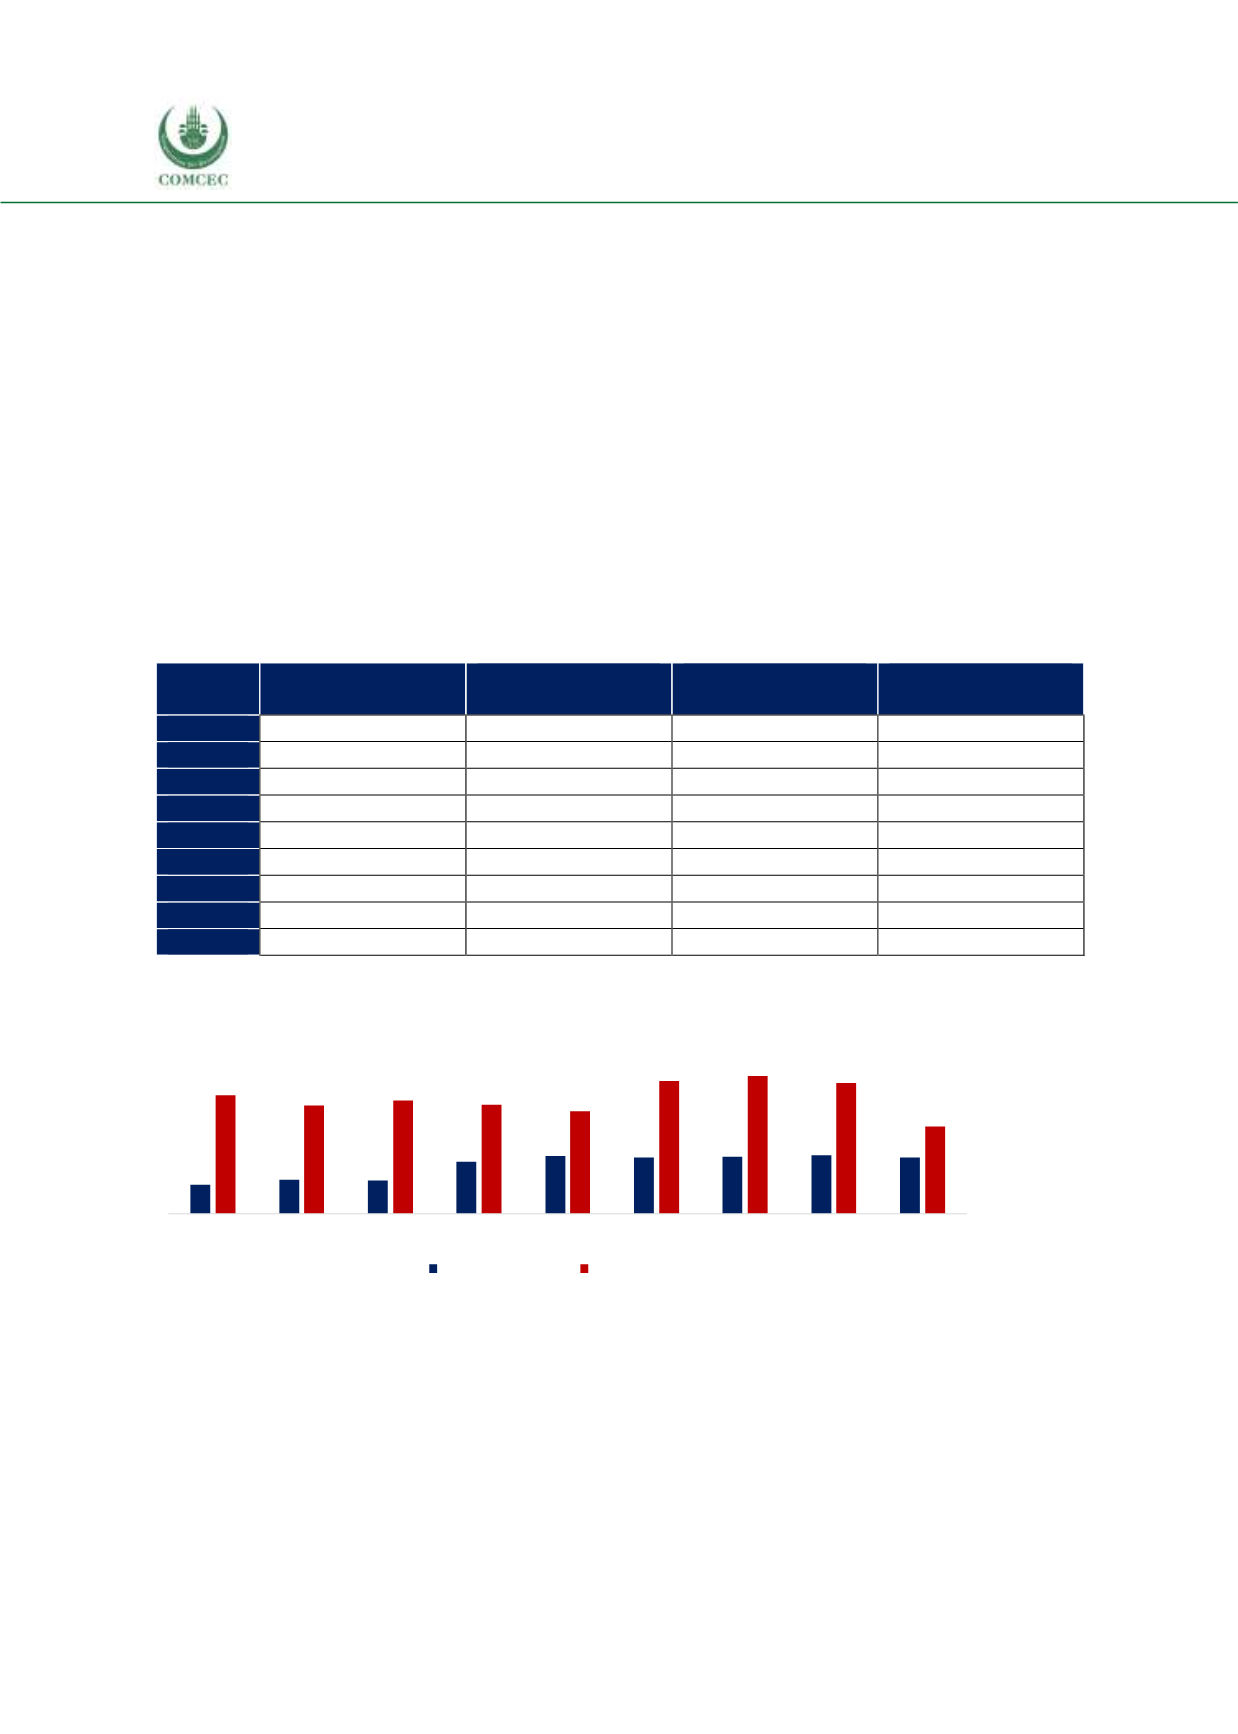
Figure 4. 37 Agricultural Exports and Imports, Million USD, Chad
Source: CEPII BACI, Eurostat RAMON, UN Comtrade, UN Trade Statistics, and authors’ calculations
Within subgroups of agricultural products,
Exports of agri-food products were 23 million USD and imports of 82 million USD in
2016, with a trade deficit of 59 million USD.
Exports of agricultural raw materials were 30 million USD with no imports, meaning a
trade surplus of 30 million USD in 2016.
No fish products were exported versus 1 million USD worth of fish products imports,
meaning the same amount of trade deficit in 2016 (see Figure 4.38).
27
32
32
49
55
54
54
55
54
113
103
108
104
98
127
131
125
83
2008
2009
2010
2011
2012
2013
2014
2015
2016
Agircultural export
Agircultural import