


 103 / 272

Reviewing Agricultural Trade Policies
To Promote Intra-OIC Agricultural Trade
91
4.2. Morocco
Morocco is a lower middle income country with a GDP of 109.8 billion USD and 3,041 USD per
capita income in 2017. Morocco ranks 58
th
in GDP (PPP) and ranks 69
th
in real growth rate
among a total of 230 countries. The average rate of economic growth in Morocco between 2010
and 2016 has been 2.2%. In 2016, Morocco’s economic growth rate has been -0.2%, inflation
rate has been 2.2% and unemployment rate has been 9.3%.
Morocco has a large agricultural sector with a 37.7% employment share of the country’s
working population in 2016. Agricultural sector accounts for 12% of the country’s GDP with a
value of 12.5 billion USD. A world leader in export of capers, green beans and argan oil; and
among the leading exporters of preserved oils, clementines and tomatoes, Morocco is the 4th
largest exporter of agri-food products in Africa. As of 2016, agricultural products exports are
21.9% of countries total exports.
Table 4. 15 Share of Agriculture in GDP, Employment and Trade, Morocco
Year
% share in GDP
% share in
employment
% share in
exports
% share in
imports
2008
12.0
41.0
21.4
13.6
2009
13.0
40.5
26.5
13.5
2010
12.9
40.2
22.5
14.8
2011
13.1
39.8
19.3
15.3
2012
12.3
39.2
18.6
14.8
2013
13.4
38.1
19.7
13.3
2014
11.7
37.3
20.5
14.4
2015
12.8
38.6
20.7
11.8
2016
12.0
37.7
20.6
12.2
Source: CEPII BACI, Eurostat RAMON, World Bank, UN Comtrade, UN Trade Statistics, and authors’
calculations
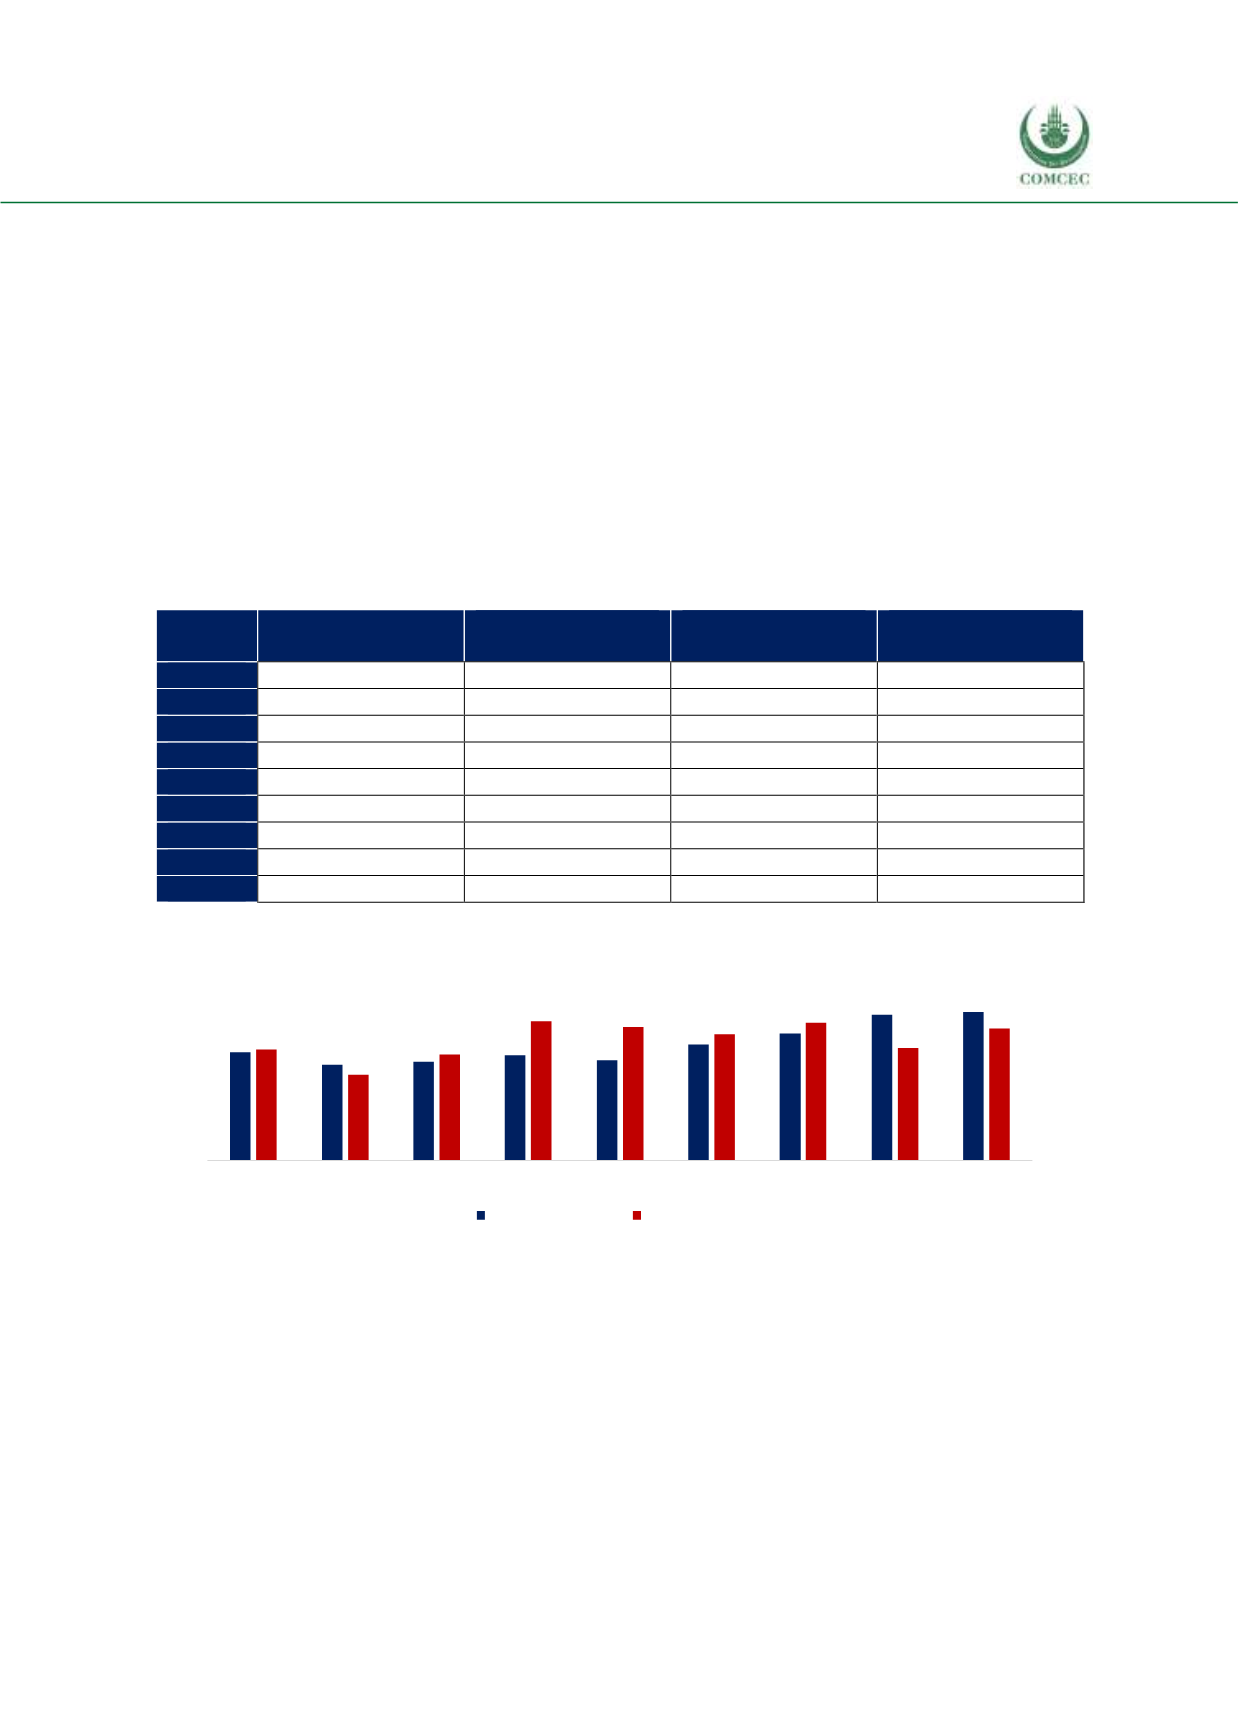
Figure 4. 13 Agricultural Exports and Imports, Billion USD, Morocco
Source: CEPII BACI, Eurostat RAMON, UN Comtrade, UN Trade Statistics, and authors’ calculations
Within subgroups of agricultural products,
Exports of agri-food products were 3.6 billion USD and imports of agri-food products
were 4.6 billion USD with a trade deficit of 0.9 billion USD in 2016.
Exports of agricultural raw materials were 0.0 billion USD and imports of agricultural
raw materials were 0.3 billion USD with a trade deficit of 0.3 billion USD in 2016.
Exports of fish products were 2.0 billion USD and imports of fish products were 0.2
billion USD with a trade surplus of 1.8 billion USD in 2016 (see Figure 4.14).
4.1
3.7
3.8
4.0
3.8
4.4
4.8
5.6
5.7
4.2
3.3
4.0
5.3
5.1
4.8
5.2
4.3
5.0
2008
2009
2010
2011
2012
2013
2014
2015
2016
Agircultural export
Agircultural import