


 39 / 152

Analysis of Agri-Food Trade Structures
To Promote Agri-Food Trade Networks
In the Islamic Countries
29
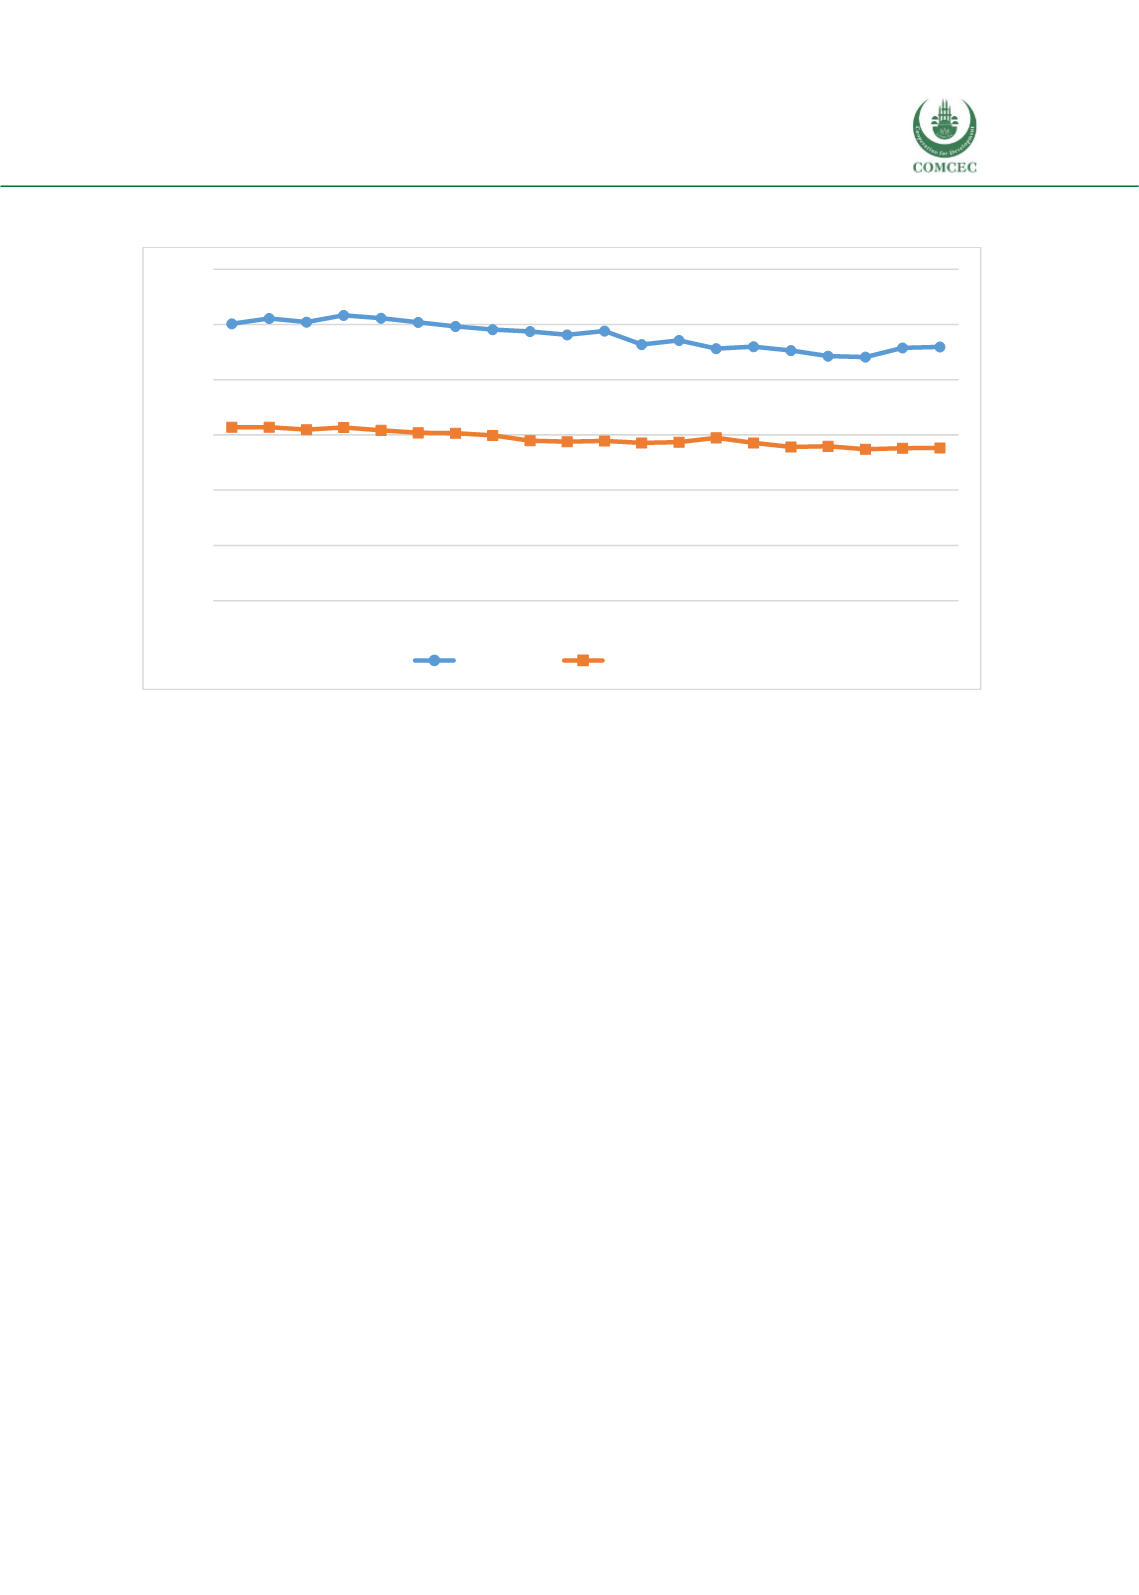
Figure 15: Trade Costs for Agricultural Products and Manufactured Goods, 1996-2015,
Percent Ad Valorem Equivalent
Source: UNESCAP-World Bank Trade Costs Database.
2.5.
Conclusions and Lessons Learned
The main findings of this section can be summarized as follows:
OIC member countries tend to be more active in global agricultural trade as importers
than as exporters.
Geographical proximity, as well as regional integration policies, favor a strong regional
dimension to flows of global agricultural trade in some sectors, but inter-regional links
are more important in others.
Consistent with the regional dimension of global agricultural trade, most liberalization
has tended to take place within regional agreements. RTAs therefore need to be high on
the policy agenda of countries intending to integrate further into world agricultural
markets.
Whereas trade in manufactured goods is often in similar product categories bilaterally,
trade in agriculture is typically driven by differences in environmental and geographical
conditions that affect agricultural productivity, and thus trade is usually in dissimilar
products.
In terms of comparative advantage, which is an indicator of future export growth, the
following findings stand out:
o
South Asia has strong comparative advantage in sectors like meat, fish and
crustaceans, cereals, vegetables, sugar products, and crude materials relative to
other agricultural sectors.
0%
50%
100%
150%
200%
250%
300%
1996 1997 1998 1999 2000 2001 2002 2003 2004 2005 2006 2007 2008 2009 2010 2011 2012 2013 2014 2015
Agriculture
Manufacturing