
Analysis of Agri-Food Trade Structures
To Promote Agri-Food Trade Networks
In the Islamic Countries
26
rates in 2016. For fish products, the difference was about 2.5 times, and for agricultural raw
materials it was over seven times. The data therefore indicate that countries typically apply
trade policies that are substantially more liberal than their WTO bound rates would suggest.
Across sectors, the lowest bound rates are in fish products, followed by agricultural raw
materials, then agri-food products. In terms of applied MFN rates, however, the order is
different: rates are lowest in agricultural raw materials, then fish products, then agri-food
products. The enhanced de facto liberalization of agricultural raw materials is likely driven by
their importance as inputs into other industries, such as clothing and apparel, as well as
processed foods. For countries interested in developing industrial capacity, it is important to be
able to access inputs of high quality at reasonable prices, so there is a clear interest in
maintaining relatively low tariffs on agricultural raw materials.
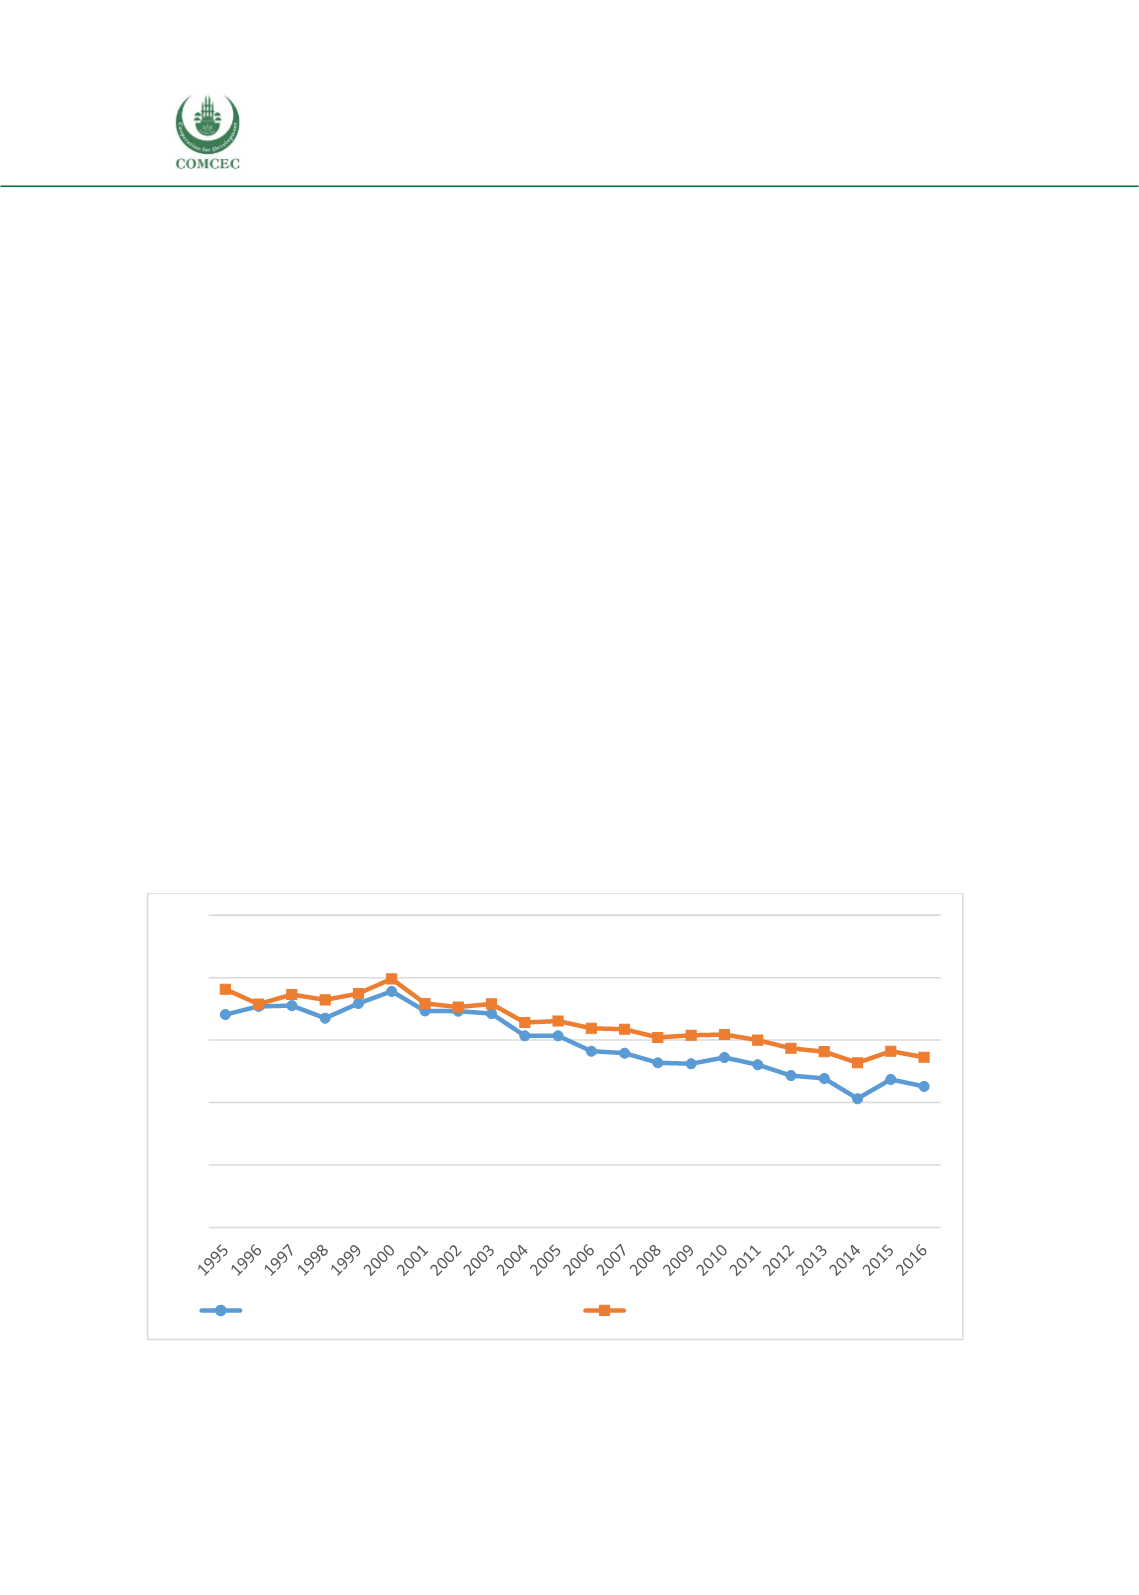
Second, there is clear evidence of liberalization in all three sectors over the last two decades.
Applied tariffs, both MFN and including preferences, are trending noticeably downwards, even
though bound rates have remained constant due to the lack of effective conclusion to the WTO’s
Doha Round of negotiations. There is a clear worldwide dynamic towards liberalizing trade in
agricultural products across all three sectors.
Third, it is important to nuance the previous point by stressing that the downwards trend in
tariff rates is more pronounced for effectively applied rates than for applied MFN rates. The
implication is that countries are tending to liberalize agricultural trade on a preferential basis
rather than a non-discriminatory one. This dynamic is most pronounced in fish products, but is
also notable in the other two sectors. This finding is consistent with the rise of regional trade
agreements since the WTO’s establishment in 1995. However, it is of concern to countries that
are not heavily involved in regional agreements, as it suggests that their ability to access trading
partners’ agricultural markets is becoming relatively more challenging over time, despite
liberalization, because preferential partners are being granted superior conditions.
Figure 12: Average Applied Tariffs on Agri-Food Products, 1995-2016, Percent Ad Valorem
Source: Authors’ calculations based on data from WITS-TRAINS.
0%
5%
10%
15%
20%
25%
Effectively Applied Rate - Agri-Food Products
Applied MFN Rate - Agri-Food Products


