


 131 / 161

Retail Payment Systems
In the OIC Member Countries
113
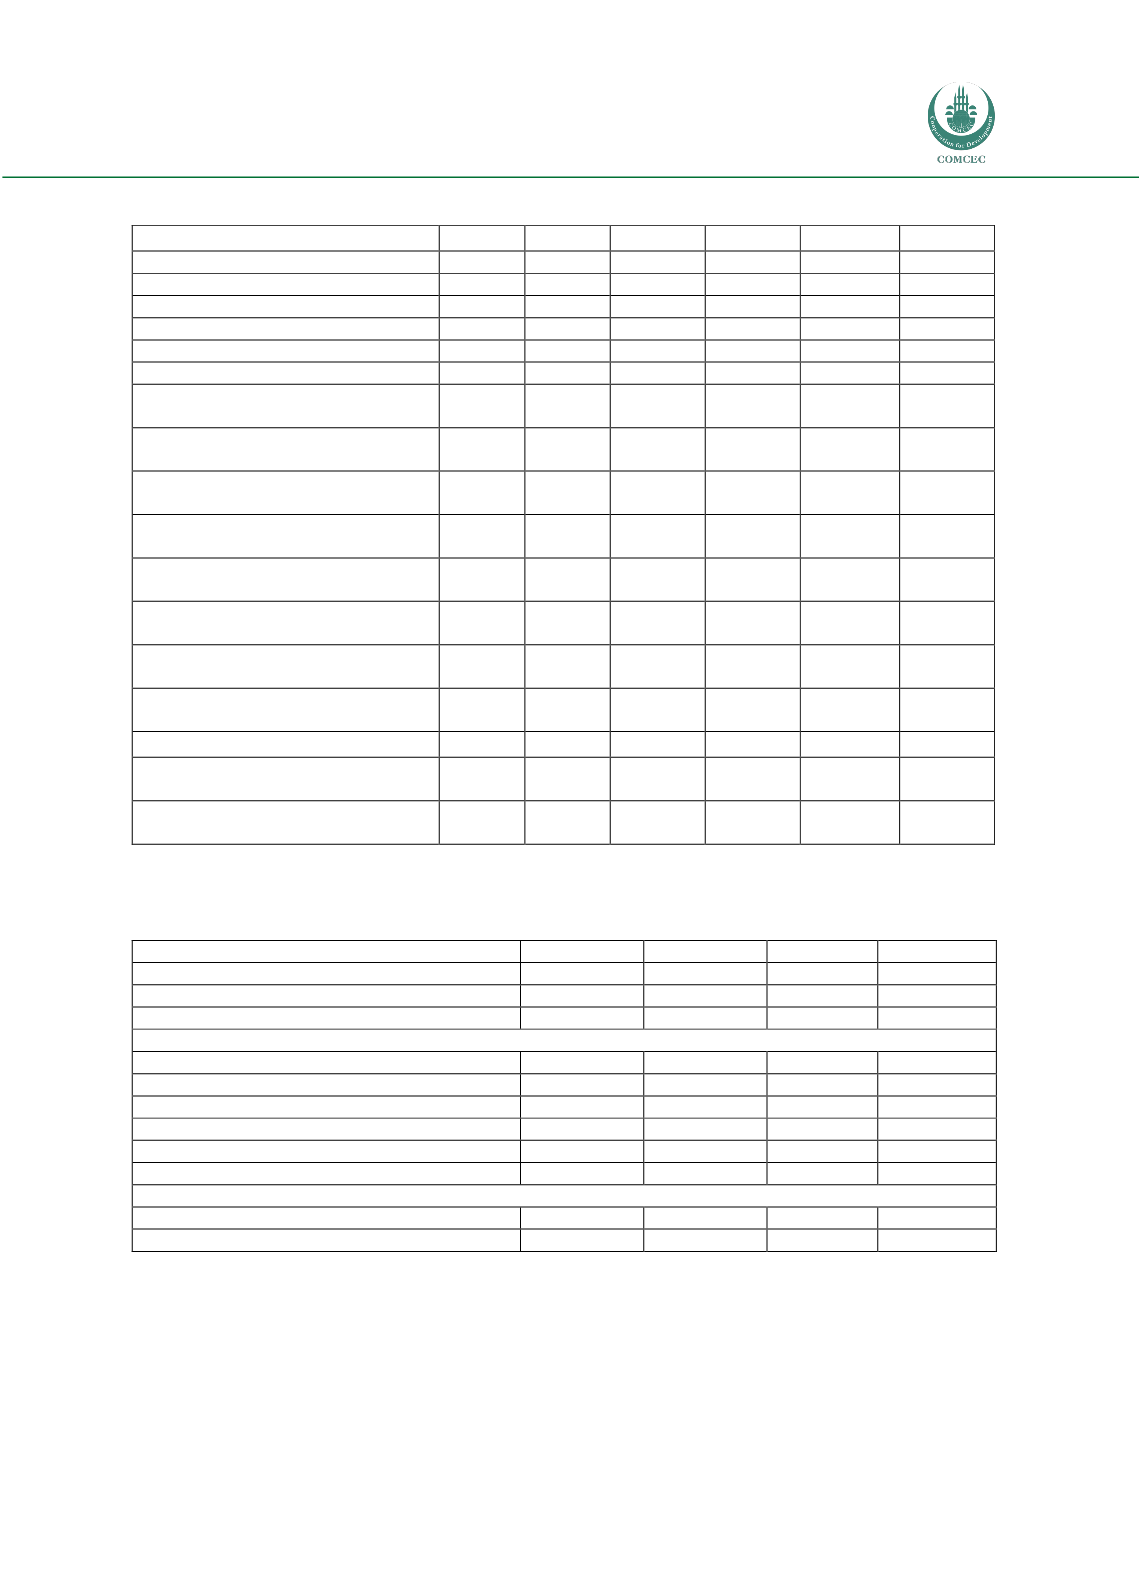
Table A5. Pakistan: Market Data and Indicators
2000
2005
2011
2012
2013
2015
Financial cards in circulation
- ATM cards (mn cards)
0.7
1.1
4.0
5.2
6.4
10.3
- Debit cards (mn cards)
0.7
1.0
3.5
4.9
5.9
9.6
- Credit cards (mn cards)
0.6
0.9
1.4
1.4
1.5
2.0
- Charge cards (mn cards)
0.1
0.1
0.3
0.3
0.3
0.3
Financial cards' transactions
- ATM cards (US$ mn, at constant
prices)
44
47
187
254
301
438
- Debit cards (US$ mn, at constant
prices)
1,100
986
1,563
1,656
1,929
3,444
- Credit cards (US$ mn, at constant
prices)
7,444
9,679
7,439
8,323
10,452
19,838
- Charge cards (US$ mn, at constant
prices)
530
689
441
489
504
653
Cash transactions (US$ mn, at
constant prices)
80,534
89,656
112,541
137,762
130,093
151,419
Other paper transactions (US$
mn, at constant prices)
4,061
4,077
4,159
4,518
4,389
4,922
Annual savings (PKR mn, at
constant prices)
411,879
643,048
760,451
771,280
801,890
890,034
Savings ratio (% of disposable
income)
4.0
4.6
4.2
4.1
4.1
4.1
Consumer lending
- Consumer credit (outstanding
balance) (US$ mn)
1,439
5,287
14,489
17,343
19,851
34,087
- Mortgages/housing (outstanding
balance) (US$ mn)
4,108
13,384
22,936
28,854
31,660
40,724
Source: National statistics, Euromonitor International
Table A6. Pakistan: Number and value of transactions
Number of transactions (000)
2006
2008
2010
2012
Electronic
20,160
33,773
53,367
74,562
Paper
82,131
84,338
-1,606
92,431
Total
102,291
118,111
144,973
166,993
% share
Electronic
19.71
28.60
36.81
44.65
Paper
80.29
71.40
63.19
55.35
Value of transactions (Rs Billion)
2006
2008
2010
2012
Electronic
2,479
4,119
4,821
6,555
Paper
25,036
39,875
40,536
43,675
Total
27,515
43,994
45,357
50,230
% share
Electronic
9.01
9.36
10.63
13.05
Paper
90.99
90.64
89.37
86.95
Source: Statistical Bulletin (2003-2012), Quarterly Reports on Payment Systems, 2006-2012,
www.sbp.org.pk.