


 129 / 161

Retail Payment Systems
In the OIC Member Countries
111
Commercial)
Electronic Direct/ACH
Transactions
0.2
0.4
0.8
1.2
1.9
2.7
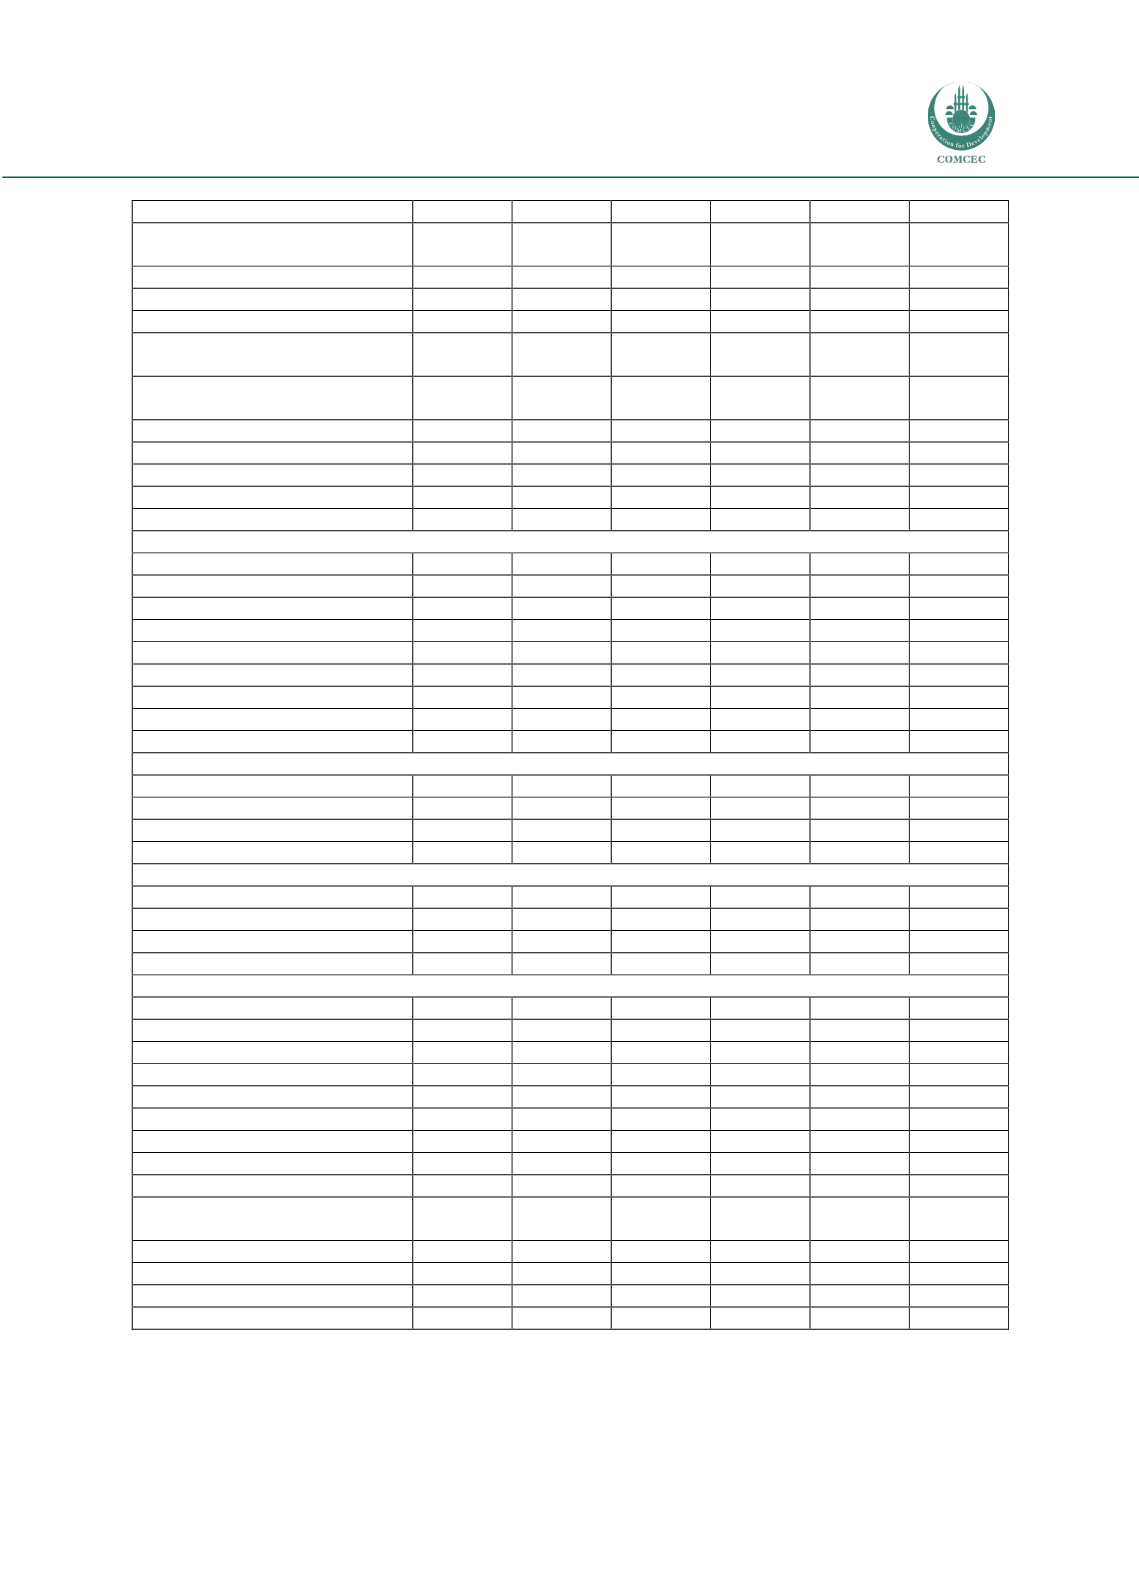
Paper Payment Transactions
4,645.3
4,749.4
4,854.6
4,961.0
5,068.0
5,175.1
- Cash Transactions
4,644.8
4,749.0
4,854.3
4,960.6
5,067.7
5,174.8
- Other Paper Payment Types
0.5
0.4
0.4
0.3
0.3
0.3
Consumer Payment
Transactions
4,907.4
5,025.3
5,150.4
5,306.6
5,435.6
5,569.6
M-Commerce by Category: Value
2009-2014 (MAD mn)
Mobile Phone M-Commerce
-
-
-
-
270.8
365.2
- Mobile Phone - Proximity
-
-
-
-
-
-
- Mobile Phone - Remote
-
-
-
-
270.8
365.2
Tablet M-Commerce
-
-
-
-
30.1
45.1
M-Commerce
88.4
115.6
155.3
213.9
300.9
410.4
Number of Cards by Issuer 2009-2013 (‘000 cards)
AttijariWafa Bank
1,373.3
1,526.7
1,525.5
1,664.1
1,879.6
n/a
Banque Populaire, Groupe
887.1
974.3
963.3
1,046.6
1,168.1
n/a
BMCE
883.0
982.0
980.7
1,070.6
1,168.1
n/a
Société Générale, Groupe
561.2
618.6
611.7
661.1
720.9
n/a
BMCI
338.2
368.7
362.0
387.7
408.8
n/a
Credit Du Maroc
266.5
286.7
277.0
292.2
318.6
n/a
CIH
87.0
98.6
99.4
110.0
122.1
n/a
Others
1,974.5
2,186.2
3,203.5
3,988.6
4,004.9
n/a
Total
6,371.0
7,041.7
8,023.2
9,220.9
9,791.1
n/a
Number of Cards by Operator 2009-2013 (‘000 cards)
Visa Inc
4,312.5
4,563.4
4,956.2
5,722.8
6,122.0
n/a
MasterCard International Inc
315.7
359.8
392.5
361.5
358.2
n/a
Others
1,742.7
2,118.6
2,674.5
3,136.5
3,310.9
n/a
Total
6,371.0
7,041.7
8,023.2
9,220.9
9,791.1
n/a
Card Payment Transactions Value by Operator 2009-2013 (MAD mn)
Visa Inc
104,660.4 113,374.9 121,985.9 140,193.8 150,076.2 n/a
MasterCard International Inc
6,617.8
7,793.4
8,673.3
8,155.1
7,928.7
n/a
Others
1,136.0
1,547.4
2,105.2
2,515.6
2,695.1
n/a
Total
112,414.1 122,715.7 132,764.4 150,864.4 160,700.0 n/a
Card Payment Transactions Value by Issuer 2009-2013 (MAD mn)
AttijariWafa Bank
28,697.3
31,506.2
34,261.8
40,027.9
43,680.6
n/a
Banque Populaire, Groupe
19,772.9
21,432.1
23,028.9
26,389.6
28,829.5
n/a
BMCE
18,395.4
20,192.6
21,975.4
24,206.9
27,889.4
n/a
Société Générale, Groupe
11,721.7
12,751.0
14,972.9
16,189.0
16,801.9
n/a
BMCI
7,548.6
8,138.3
8,707.1
10,162.8
11,074.6
n/a
Credit Du Maroc
5,578.3
5,939.2
6,247.6
6,815.4
7,494.3
n/a
CIH
1,808.4
2,013.2
2,236.8
2,668.8
3,098.7
n/a
Aksal Groupe SA
267.0
367.4
504.9
675.7
811.0
n/a
Marjane Holding SA
263.0
362.0
497.4
642.8
754.9
n/a
Comptoir Métallurgique
Marocain
140.1
192.8
265.0
328.1
387.6
n/a
Digibuy SA
78.0
107.3
147.5
182.6
216.5
n/a
Al Mazar SA
64.3
88.4
121.5
154.2
176.6
n/a
Others
18,079.0
19,625.2
19,797.5
22,420.5
19,484.2
n/a
Total
112,414.1 122,715.7 132,764.4 150,864.4 160,700.0 n/a
Source: Euromonitor International from official statistics, trade associations, trade press, company research,
trade interviews, trade sources