


 130 / 161

Retail Payment Systems
In the OIC Member Countries
112
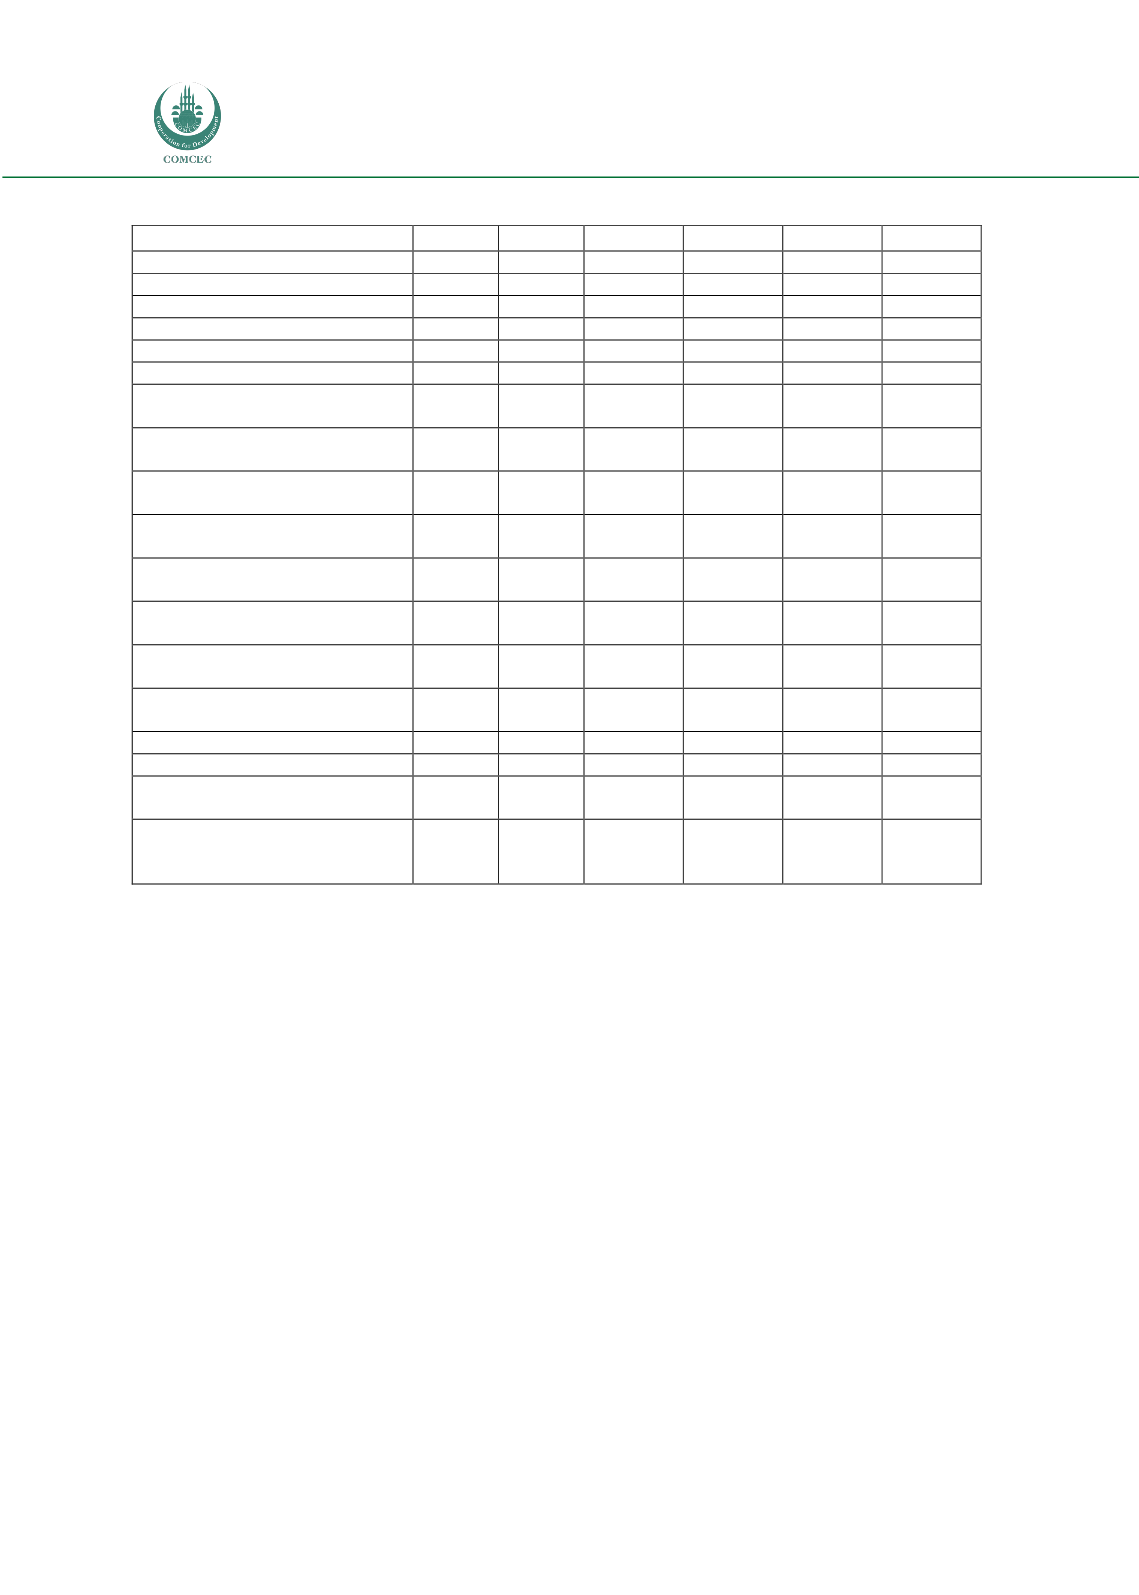
Table A4. Nigeria: Market Data and Indicators
2000
2005
2010
2011
2012
2015
Financial cards in circulation
- ATM cards (mn cards)
0.5
0.6
0.9
1.0
1.1
1.3
- Debit cards (mn cards)
0.4
0.5
0.7
0.7
0.8
0.9
- Credit cards (mn cards)
-
0.1
0.2
0.2
0.2
0.3
- Charge cards (mn cards)
0.2
0.3
0.3
0.3
0.3
0.4
Financial cards' transactions
- ATM cards (US$ mn,
at constant prices)
2,832
4,240
5,254
5,151
5,570
6,483
- Debit cards (US$ mn, at
constant prices)
47
1,168
7,261
7,278
7,967
10,689
- Credit cards (US$ mn, at
constant prices)
1,174
3,031
2,886
3,015
3,364
4,674
- Charge cards (US$ mn, at
constant prices)
1,178
1,834
1,733
1,821
2,020
2,799
Cash transactions (US$ mn, at
constant prices)
25,593
35,898
40,603
42,141
46,223
57,163
Other paper transactions (US$
mn, at constant prices)
1,125
1,410
1,362
1,292
1,330
1,316
Annual savings (NGN mn, at
constant prices)
621,114
942,672
1,224,618
1,127,106
1,141,905
1,280,497
Savings ratio (% of disposable
income)
5.7
4.1
4.2
4.3
4.4
4.5
Annual lending rate (%)
21.3
17.9
17.6
16.0
16.8
-
Consumer lending
- Consumer credit (outstanding
balance) (US$ mn)
7,246
12,105
15,443
16,050
17,601
23,368
-
Mortgages/housing (outstanding
balance) (US$ mn)
15,270
29,860
50,217
51,414
53,226
61,849
Source: National statistics, Euromonitor International