
Retail Payment Systems
In the OIC Member Countries
107
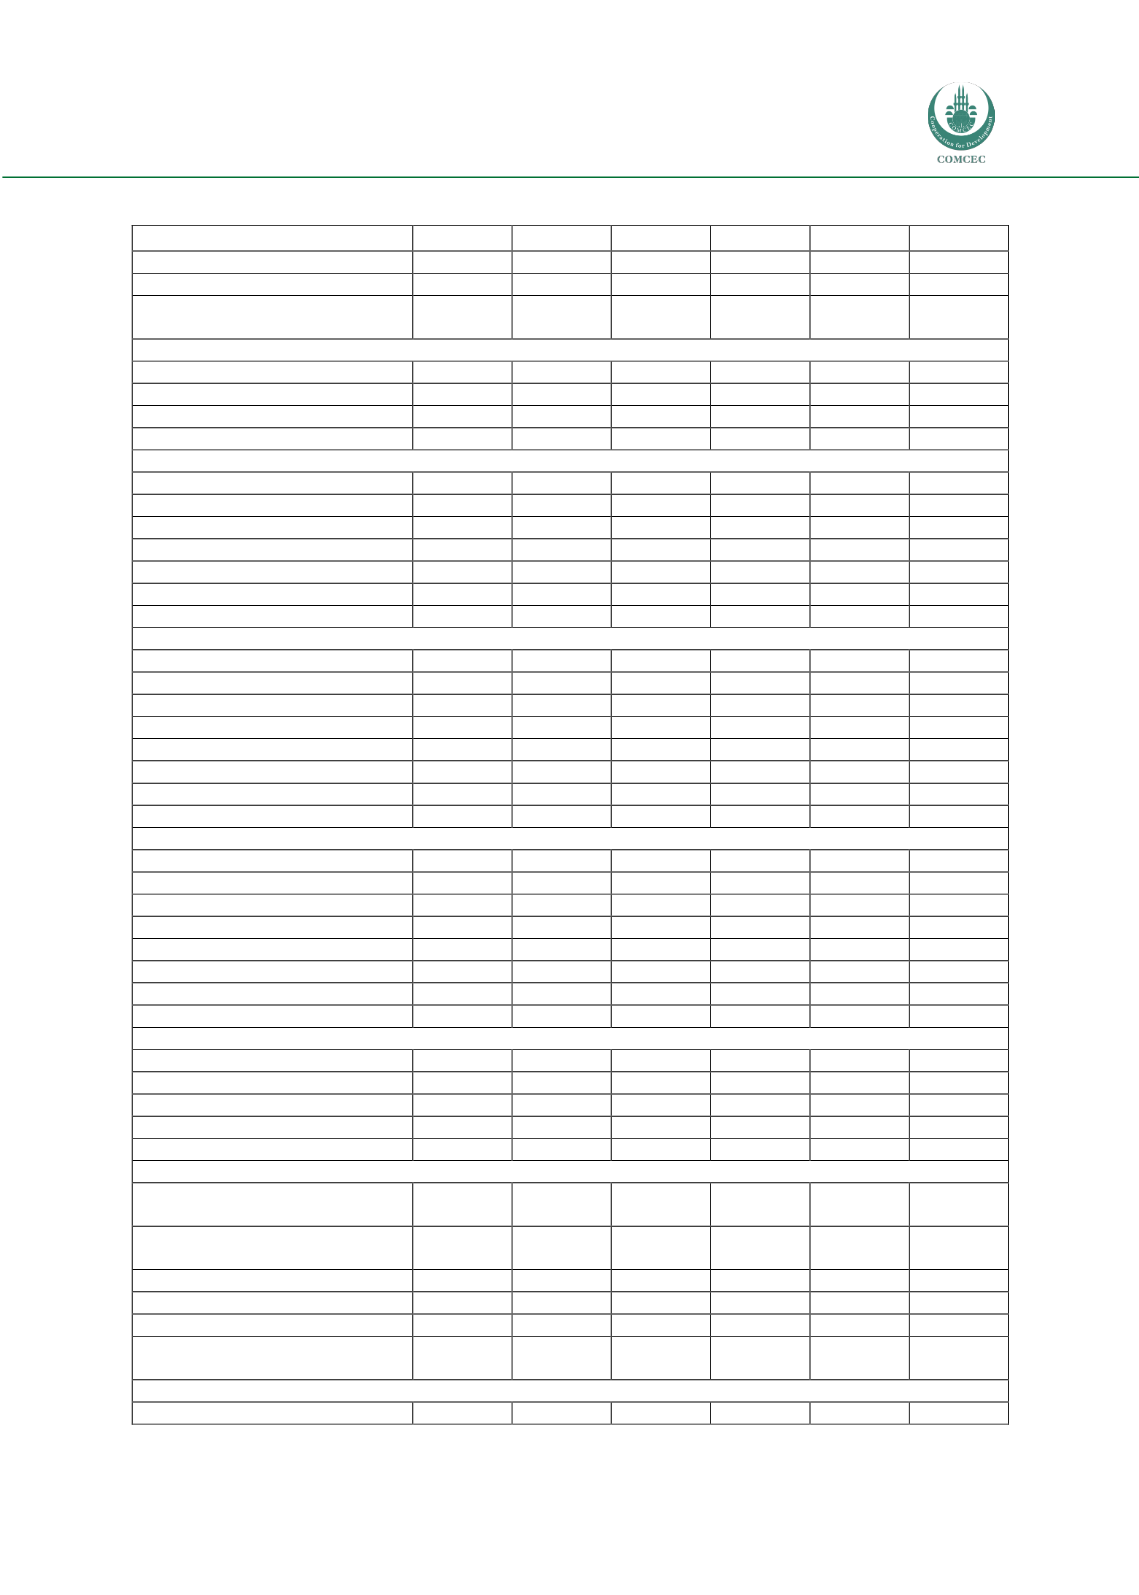
Table A2. Indonesia: Market Data and Indicators
2009
2010
2011
2012
2013
2014
No of POS terminals (‘000 units)
262.6
315.2
381.4
495.5
581.8
698.1
No of ATMs (‘000 units)
33.2
47.0
54.5
59.3
68.0
76.3
Value Lost to Fraud 2009-2014
(IDR mn)
44,361.9
39,397.6
36,732.0
39,003.1
34,180.0
31,342.2
Financial Cards in Circulation by Type: % Number of Cards 2009-2014
Contact Smart Cards
20.0
20.7
22.5
23.0
25.0
27.0
Contactless Smart Cards
7.5
13.8
16.1
20.0
20.5
21.0
Non-Smart Cards
72.5
65.4
61.4
57.0
54.5
52.0
Total
100.0
100.0
100.0
100.0
100.0
100.0
Number of Cards in Circulation 2009-2014 ('000 cards)
ATM Function
56,789.4
65,213.8
78,170.7
92,569.7
104,554.0 118,386.3
Charge Card Function
405.8
444.4
453.9
457.7
456.2
454.3
Credit Function
11,826.4
13,096.3
14,296.8
14,324.6
14,635.5
15,176.1
Debit Function
41,151.9
48,873.1
59,761.3
73,219.4
83,170.1
95,313.0
Pre-Paid Function
4,850.3
10,644.0
14,509.0
23,499.6
29,620.9
37,108.0
Store Cards
-
-
-
-
-
-
Financial Cards in Circulation
61,625.1
74,661.8
92,651.6
115,379.5 132,514.8 152,724.2
Financial Cards Transactions by Category: Value 2009-2014 (IDR tn)
ATM Transactions
796.0
930.5
1,162.1
1,426.7
1,678.6
1,945.9
Card Payment Transactions
189.3
224.7
263.7
310.8
369.7
465.8
- Charge Card Transactions
4.7
5.6
6.3
6.9
7.6
8.6
- Credit Card Transactions
128.0
153.1
171.9
190.6
211.5
235.2
- Debit Transactions
56.2
65.3
84.6
110.7
147.1
217.5
- Pre-Paid Transactions
0.4
0.7
1.0
2.5
3.5
4.5
- Store Card Transactions
-
-
-
-
-
-
Total Cards Transactions
985.3
1,155.2
1,425.9
1,737.4
2,048.2
2,411.7
Financial Cards by Category: Number of Transactions 2009-2014 (mn transactions)
ATM Transactions
1,139.4
1,307.6
1,620.7
1,958.2
2,304.9
2,651.0
Card Payment Transactions
295.6
348.4
393.3
510.6
644.8
815.9
- Charge Card Transactions
3.3
3.5
3.8
4.0
4.3
4.5
- Credit Card Transactions
176.7
193.5
204.1
216.7
234.3
253.9
- Debit Transactions
98.2
111.7
138.3
184.9
242.9
340.9
- Pre-Paid Transactions
17.5
39.7
47.1
105.0
163.3
216.6
- Store Card Transactions
-
-
-
-
-
-
Total Cards Transactions
1,435.0
1,656.1
2,014.0
2,468.7
2,949.7
3,466.9
Financial Cards by Category: Number of Accounts 2009-2014 ('000 accounts)
Charge Card Function
335.3
337.6
341.7
344.1
342.6
339.1
Credit Function
4,548.6
4,793.7
5,225.1
5,799.9
6,959.9
7,358.7
Debit Function
41,151.9
48,873.1
59,761.3
73,219.4
83,170.1
95,313.0
Store Cards
-
-
-
-
-
-
Financial Cards in Circulation
46,035.8
54,004.4
65,328.1
79,363.4
90,472.6
103,010.7
Consumer Payments by Category: Value 2009-2014 (IDR tn)
Card Payment Transactions (Excl
Commercial)
182.8
217.1
255.1
300.2
357.1
451.4
Electronic Direct/ACH
Transactions
542.4
677.9
831.2
963.1
1,059.5
1,181.3
Paper Payment Transactions
3,028.6
3,354.9
3,730.3
4,134.8
4,663.0
4,927.8
- Cash Transactions
3,027.5
3,353.7
3,728.8
4,133.2
4,661.2
4,925.9
- Other Paper Payment Types
1.1
1.2
1.4
1.5
1.7
1.9
Consumer Payment
Transactions
3,753.8
4,250.0
4,816.6
5,398.1
6,079.6
6,560.5
Consumer Payments by Category: Number of Transactions 2009-2014 (mn transactions)
Card Payment Transactions (Excl
284.9
336.9
380.9
496.2
628.4
797.4


