


 110 / 221

Risk Management in
Islamic Financial Instruments
81
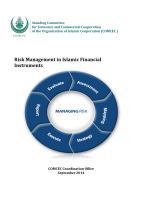
Chart 4.24: Net Interest (Profit) Revenues (Expenses) / Average Total Assets (%)-Ratio
Source: Turkish Banking Sector Interactive Bulletin 2014
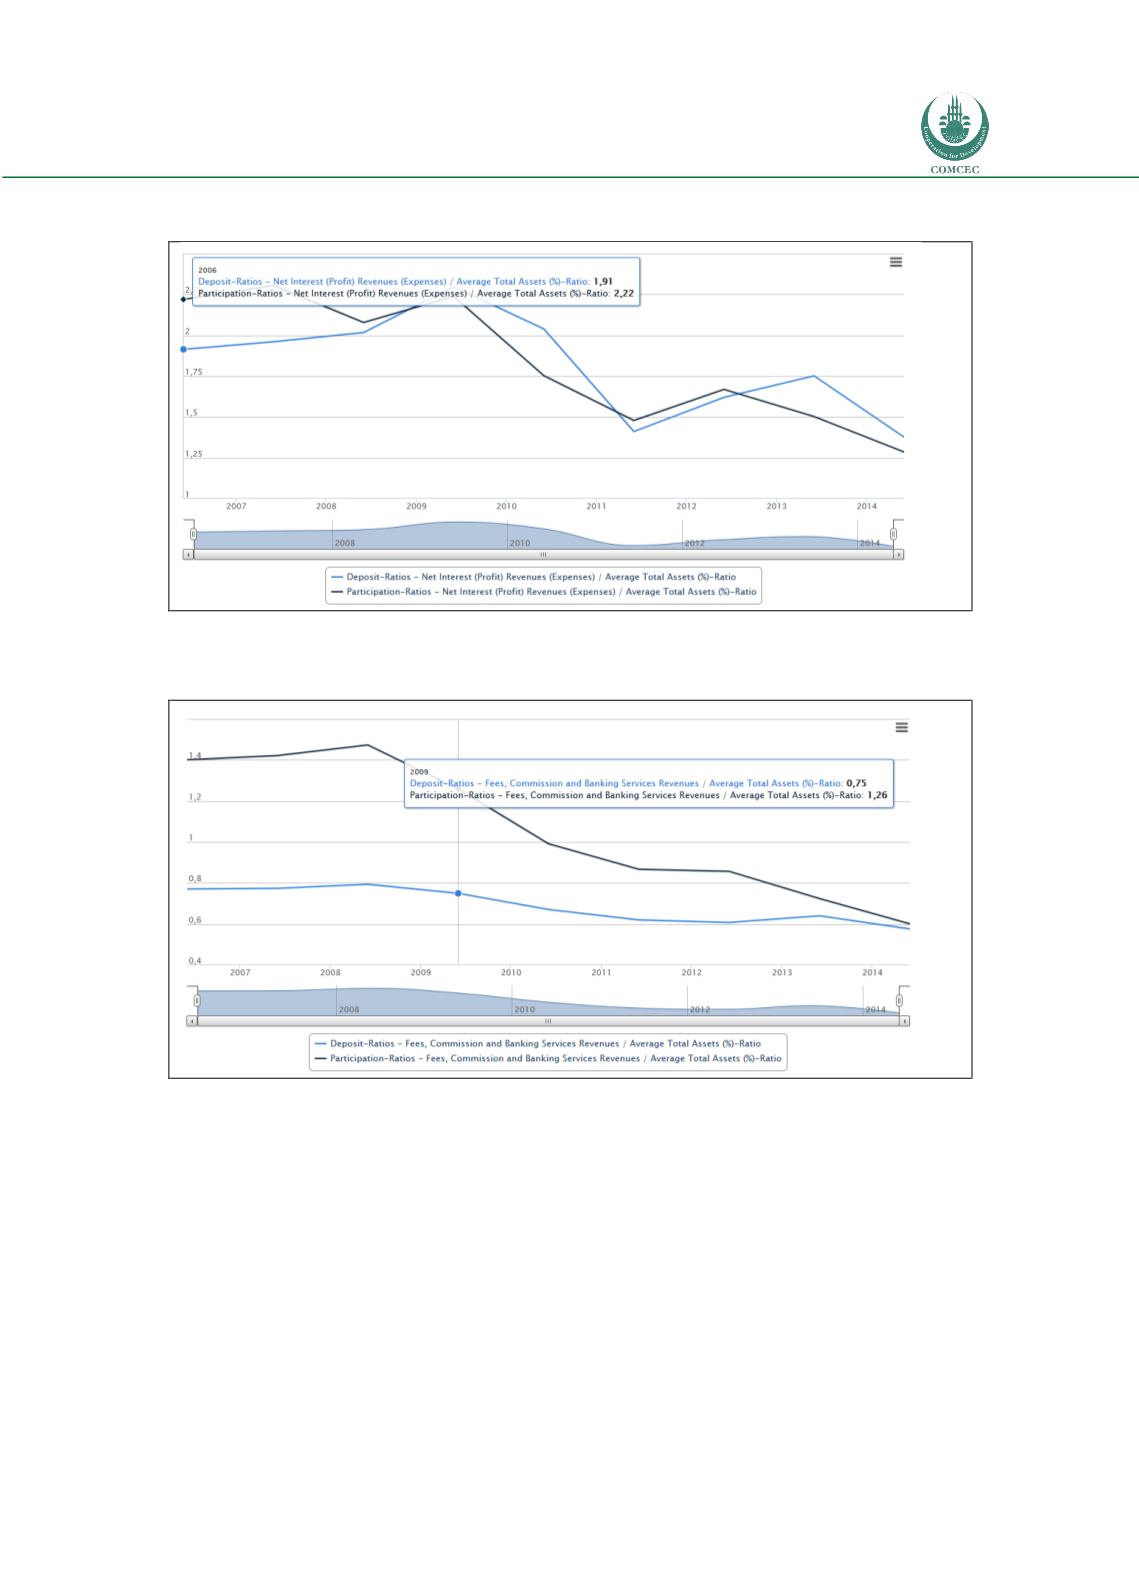
Chart 4.25: Fees, Commission and Banking Services Revenues / Average Total Assets (%)-
Ratio
Source: Turkish Banking Sector Interactive Bulletin 2014
The Second set of operational efficiency ratios focuses on the uses of branches (see Chart 4.26
and Chart 4.27) and the performance of staff (see Chart 4.28). The Average Total
Assets/Average Number of Total Staff Ratio exhibits an increasing trend for both the
conventional banks (from USD 2446.44 asset /per staff in 2005 to USD 8428.96 asset /per staff
in 2014) and the Islamic banks (from USD 1459.42 asset /per staff in 2005 to USD 5590.46
asset /per staff in 2014). However, the ratios are generally lower for the Islamic banks.
Similarly, the Total Deposit (Funds Collected)/Average Number of Total Staff ratios show an
increasing trend for both conventional banks (from USD 1602.80deposit /per staff in 2005 to
USD 4642.83deposit/per staff in 2014) and Islamic banks (from USD 1315.39 deposit /per
staff in 2005 to USD 3478.24 deposit/per staff in 2014).