


 114 / 221

Risk Management in
Islamic Financial Instruments
85
compared to that of conventional banks (1.04% and 8.23%). However, conventional banks
have higher dividend payout ratios. (See Chart 4.33)
Liquidity Ratios
Chart 4.34 shows that, on average, Islamic banks in Turkey maintain a better liquidity position,
compared to conventional banks. The Interbank ratio of 139% for the Islamic banks suggests
that they are lenders to the interbank market, while the conventional banks are borrowers on
average, with an average interbank ratio of 82.97%. Higher ratios of Net Loans / Cust & ST
Funding and Net Loans / Tot Dep & Bor. imply lower liquidity, which is the representative
trend for conventional banks, compared to Islamic banks.
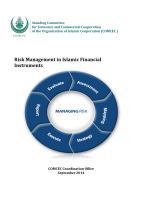
Chart 4.31: Asset Quality Ratios for Turkish Banks
Source: BankScope Database 2013
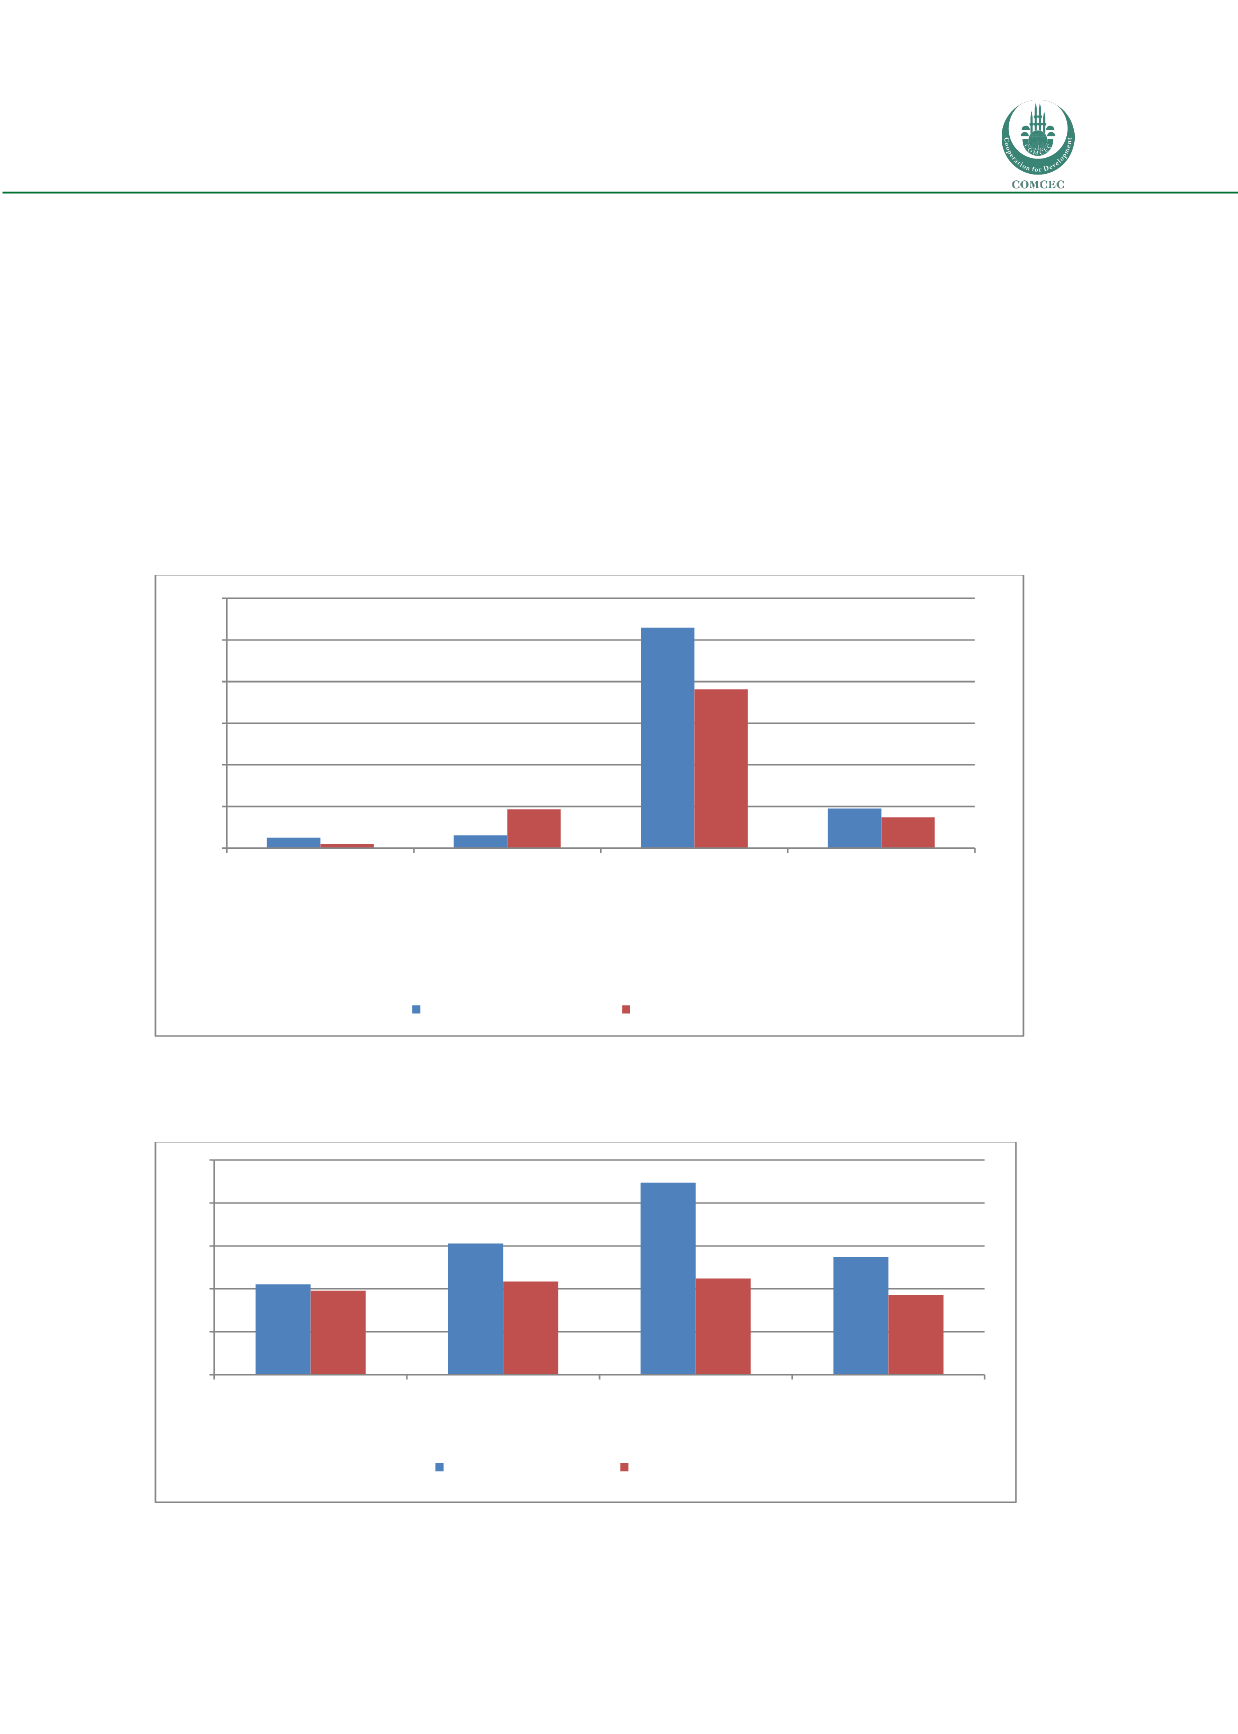
Chart 4.32: Capital Adequacy Ratio for Turkish Banks
Source: BankScope Database 2013
4,97
6,20
105,86
19,08
2,12
18,61
76,29
14,86
0
20
40
60
80
100
120
Loan Loss Res / Gross Loans
%
2011
Loan Loss Prov / Net Int Rev
%
2011
Loan Loss Res / Impaired
Loans
%
2011
NCO / Net Inc Bef Ln Lss
Prov
%
2011
Turkey Conventional
Turkey Islamic
10,52
15,30
22,36
13,70
9,76
10,87
11,21
9,28
0
5
10
15
20
25
Tier 1 Ratio
%
2011
Total Capital Ratio
%
2011
Equity / Net Loans
%
2011
Equity / Liabilities
%
2011
Turkey Conventional
Turkey Islamic