


 113 / 221

Risk Management in
Islamic Financial Instruments
84
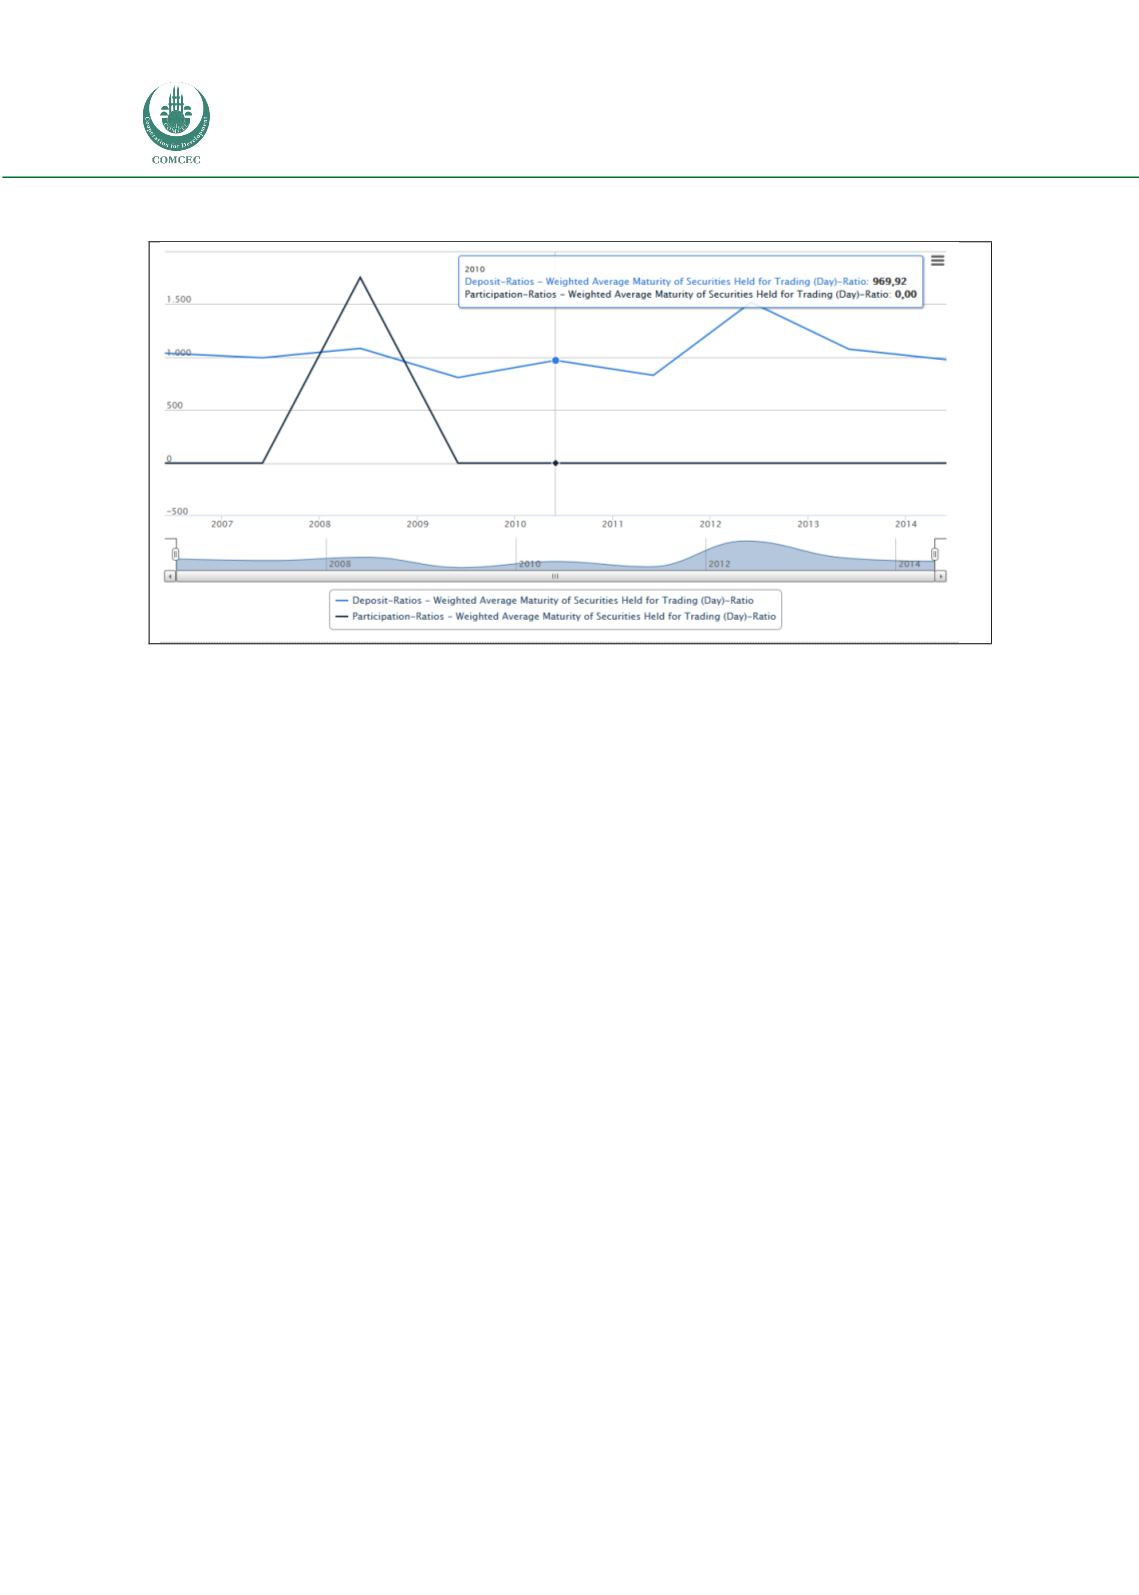
Chart 4.30: Weighted Average Maturity of Securities Held for Trading (Day)-Ratio
Source: Turkish Banking Sector Interactive Bulletin 2014
4.4.2.3 Risk Matrices
The following the comparison between the risk matrices for Islamic and conventional banks in
the Turkish banking sector is based on the BankScope dataset.
Asset Quality Ratios
Asset qualities for the Turkish Islamic banks are mixed when compared to their conventional
banking competitors. While the Average Loan Loss Res/Gross Loans ratio is lower for Islamic
banks at 2.11%, compared to that of the conventional banks of 4.97%, other ratios are higher.
(See Chart 4.31)
Capital Adequacy ratios
In general, conventional banks in Turkey keep a higher capital cushion, compared to their
Islamic banking counterparts. Chart 4.32 shows that The Equity / Tot Assets ratio and the
Equity / Net Loans ratio of the Islamic banks, at 9.76% and 10.87%, respectively, are lower
than those of the conventional banks, at 10.52% and 15.29%, respectively. These ratios reflect
the fact that Islamic banks in Turkey may be prone to insolvency risk compared to
conventional banks at the advent of financial crisis.
Operational Efficiency ratios
In general, higher operating ratios represent lower cost of funds, higher efficiency, and higher
yields on equity and assets. Higher ratios for NIM, Net Int Rev/Average Asset and Non Int Exp/
Avg Assets for the Turkish conventional banks (4.93%, 4.45% and 4.47%), compared to those
of the Islamic banks (3.48%, 2.94% and 3.19%) reflect that conventional banks, in general,
enjoy benefits from cheaper sources of funding. However, the Return On Avg Assets (ROAA)
and Return On Avg Equity (ROAE) are both higher for Islamic banks (1.24% and 11.05%),