


 107 / 221

Risk Management in
Islamic Financial Instruments
78
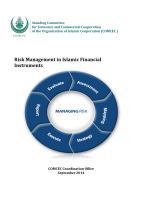
Chart 4.19: Demand Deposit (Funds Collected) / Total Deposit (Funds Collected) (%)-Ratio
Source: Turkish Banking Sector Interactive Bulletin 2014
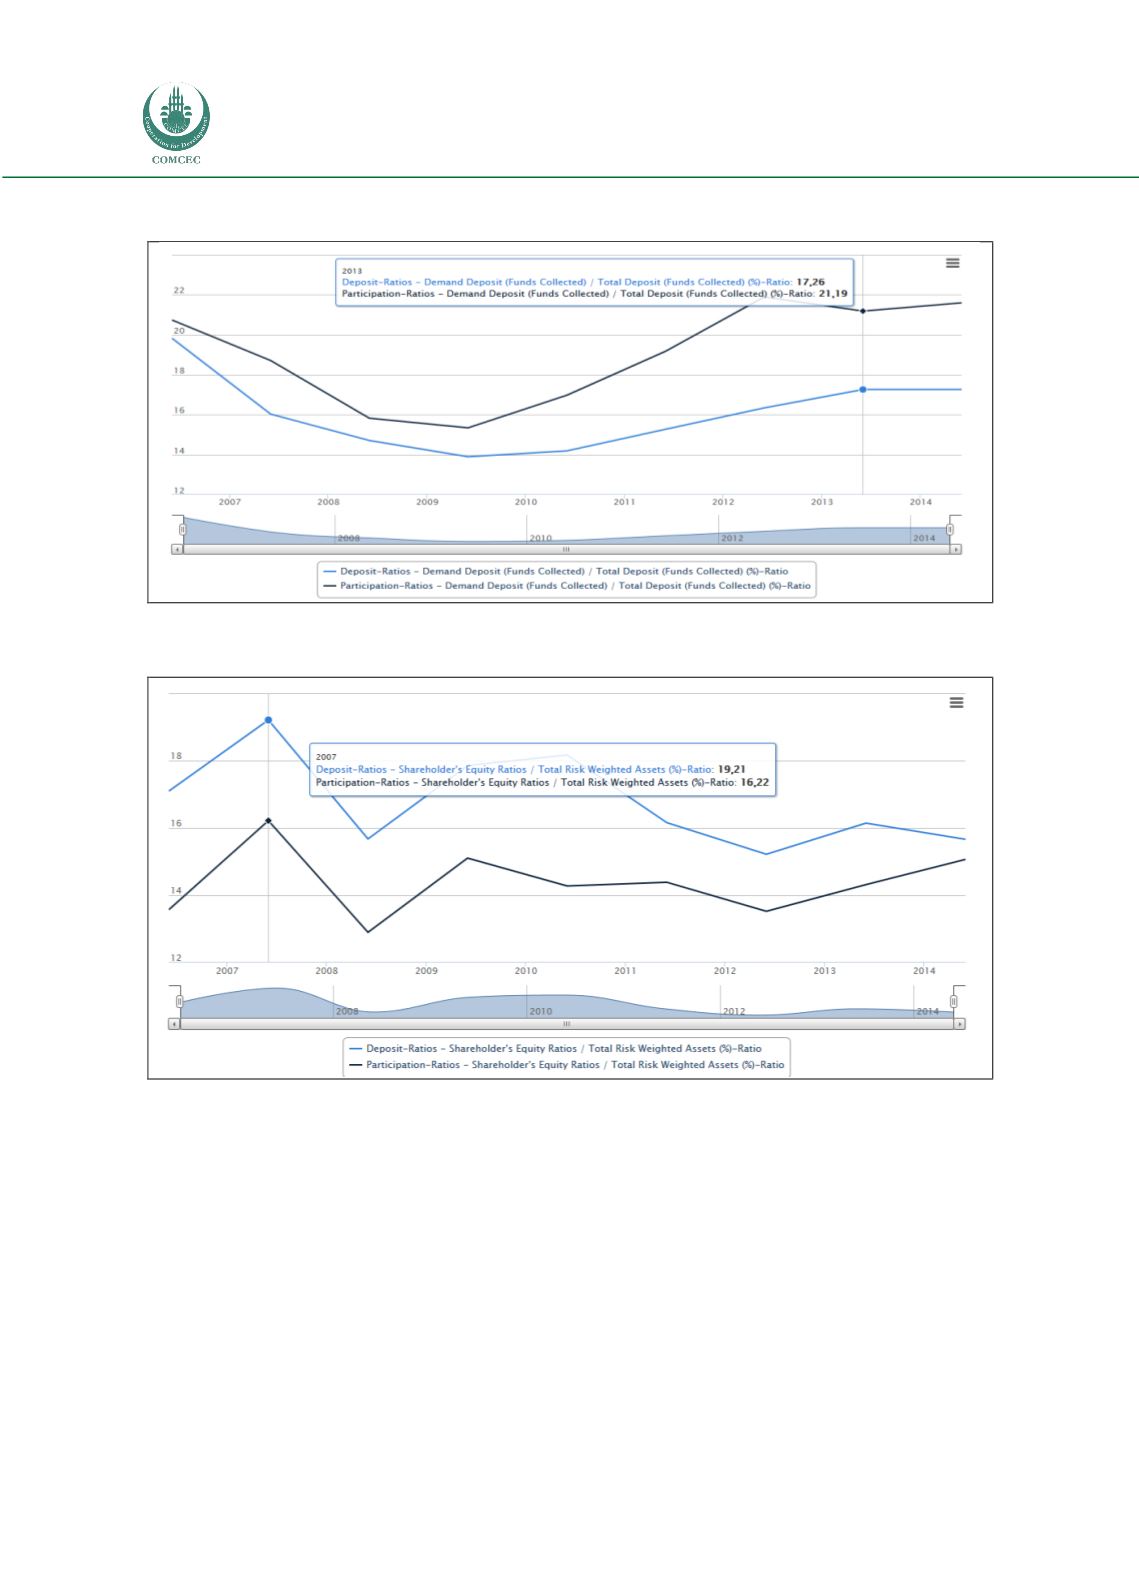
Chart 4.20: Shareholder's Equity Ratios / Total Risk Weighted Assets (%)-Ratio
Source: Turkish Banking Sector Interactive Bulletin 2014
Operational Efficiency Ratios
Two sets of operational efficiency ratios are analyzed. The first set consists of the return ratios,
namely a) Net Income / Average Total Assets (%)-Ratio, b) Net Income / Average
Shareholder's Equity (%)-Ratio, c) Total Interest (Profit Share) Income / Interest (Profit)
Bearing Assets Average (%)-Ratio, d) Net Interest (Profit) Revenues (Expenses) / Average
Total Assets (%)-Ratio Fees, and e) Commission and Banking Services Revenues / Average
Total Assets (%)-Ratio, as depicted in Chart 4.21 through Chart 4.25, respectively.
From 2005 to 2014, ROA or Net Income / Average Total Assets (%) for the conventional banks
has been consistently higher than those of the Islamic banks. However, for both types of banks,
ROAs are decreasing over time. A similar trend is also evident for ROEs, or Net Income /