


 110 / 228

Infrastructure Financing through Islamic
Finance in the Islamic Countries
94
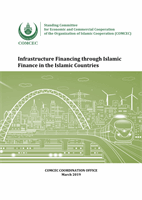
private retirement scheme funds (RM 720 million) and Islamic ETFs (470 million) are
relatively small, but these represent 32.3% and 24.2% of the overall funds respectively,
indicating the overall small size of these fund segments.
Chart 4.2. 5: Islamic Asset/Wealth Management Segments (2017) (RM billion)
Source: SCM (2017)
4.2.2.
Current Status and Projected Investments in Infrastructure Sectors
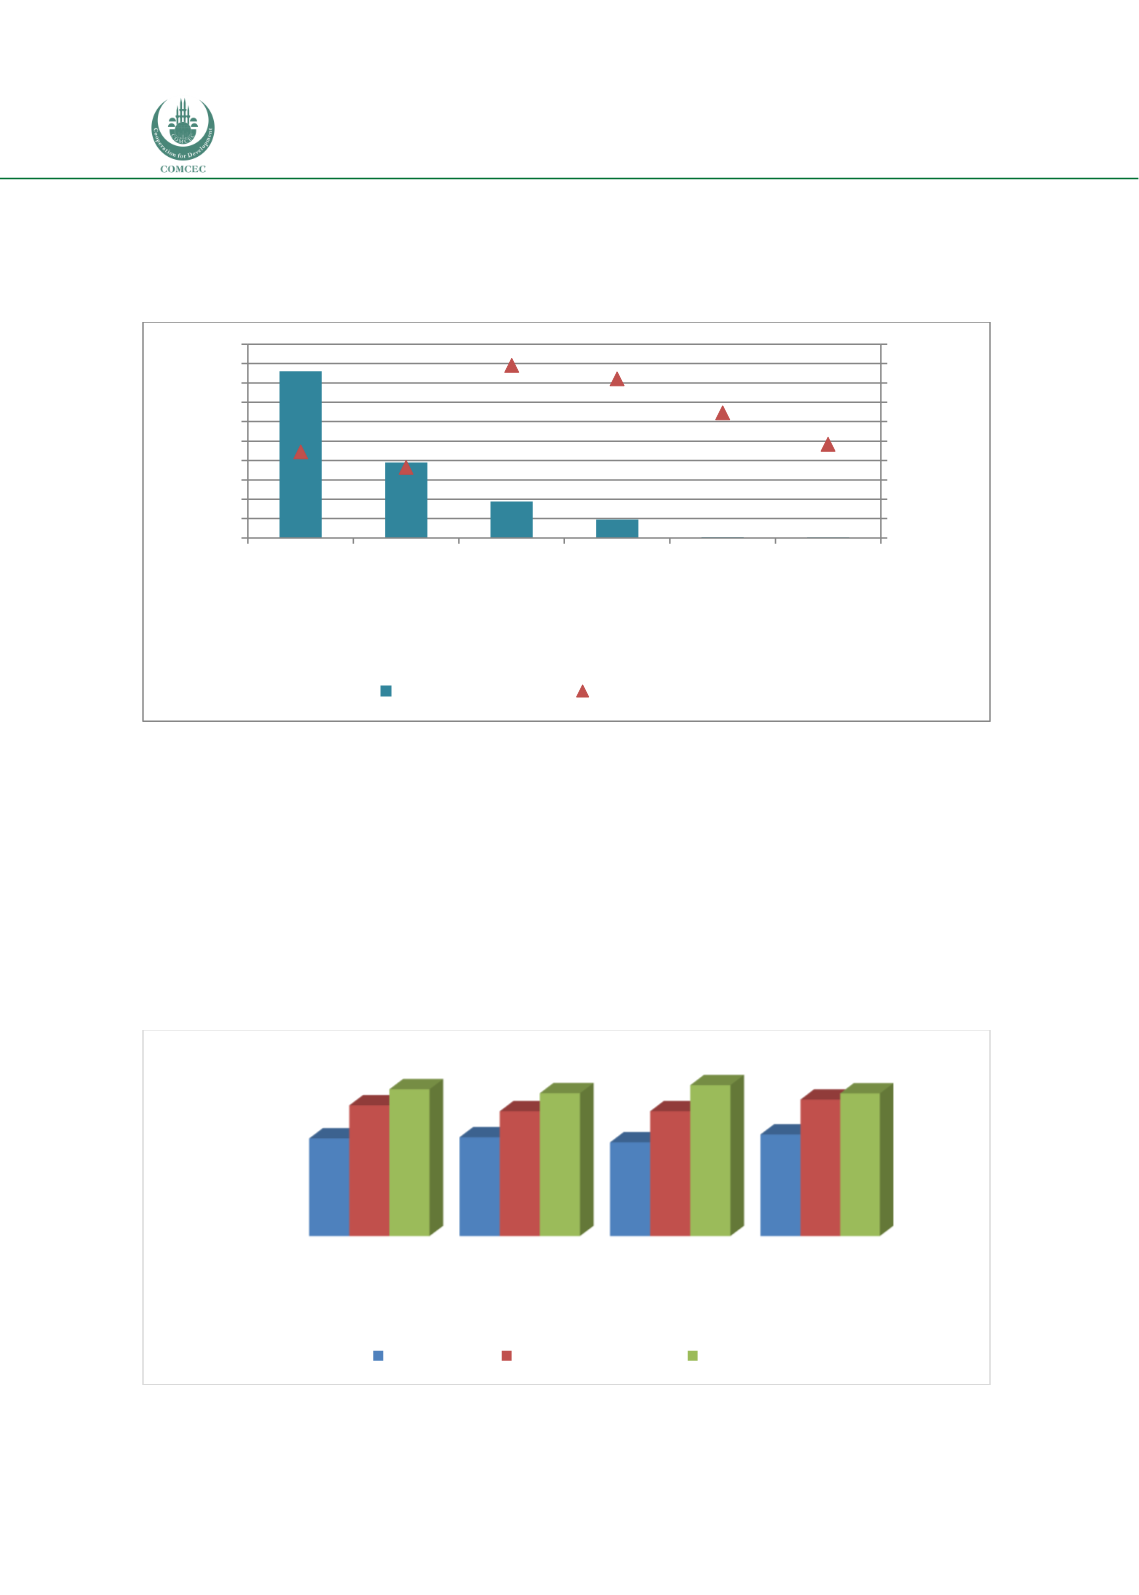
Malaysia has relatively good infrastructure compared to its peers in both the OIC and the East
Asia and Pacific (EAP) region. Chart 4.2.6 shows that not only is the overall index of
infrastructure of Malaysia better (5.5) than the averages of the OIC (3.6) and EAP region (4.9).
The quality of the infrastructure is also ranked higher than the two country groupings. The
average index of the two infrastructure segments related to transportation and electricity and
telephony are also higher than the averages of the two country groupings.
Chart 4.2. 6: Relative Status of Infrastructure in Malaysia (2017) (1-7 Best)
Source: WEF (2018), The Global Competitiveness Index Historical Dataset
172.16
77.78
37.72
19.07
0.72
0.47
22.2%
18.2%
44.5%
41.0%
32.3%
24.2%
0%
5%
10%
15%
20%
25%
30%
35%
40%
45%
50%
0
20
40
60
80
100
120
140
160
180
200
Islamic Assets
Under
Management
Islamic Unit
Trust Funds
Islamic
Wholesale
Funds
Islamic REITs Islamic
Private
Retirement
Scheme
Funds
Islamic ETFs
Percentage of total
RM Billion
Value (RM Billion)
% of overall industry
0.0
1.0
2.0
3.0
4.0
5.0
6.0
Overall
Infrastucture
Quality of overall
infrastructure
Transport
infrastructure
Electricity and
telephony
infrastructure
3.6
3.7
3.5
3.8
4.9
4.6
4.6
5.1
5.5
5.3
5.6
5.3
Index Value (1-7 best)
OIC Average East Asia and Pacific Malaysia