


 101 / 247

80
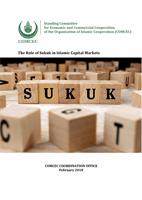
Chart 4.6: Malaysia’s Corporate Sukuk vs Conventional Issuance (2006-June 2017)
0.00
20.00
40.00
60.00
80.00
100.00
120.00
140.00
160.00
180.00
2006
2007
2008
2009
2010
2011
2012
2013
2014
2015
2016 June 2017
RMbillion
Sukuk issuance
Conventional issuance
RM79.3
billion
RM137.7
billion
62
%
RM78.9
billion
58
%
Source: BPAM
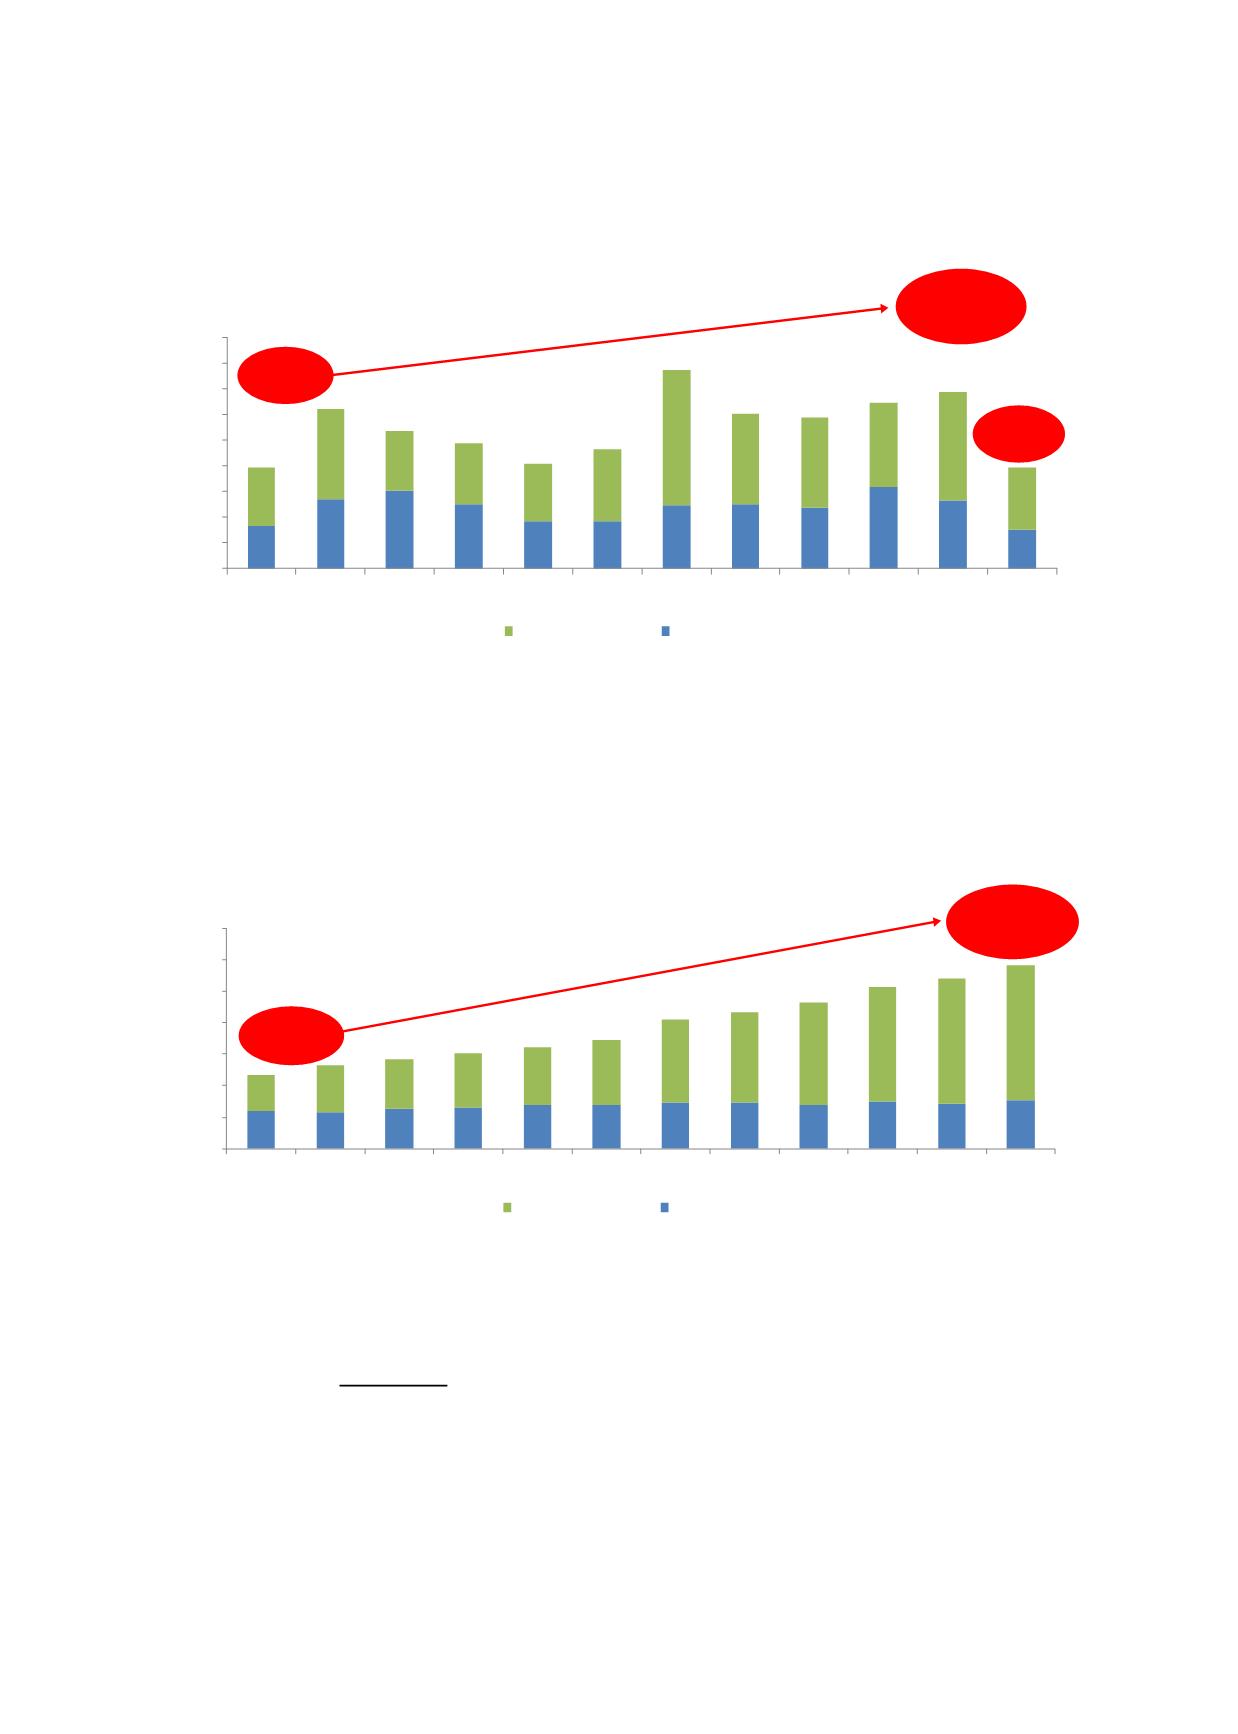
As at end-June 2017, sukuk issuance represented a hefty 73% of total outstanding quasi-
government and corporate bond issuance (refer to Chart 4.7). Based on our analysis, the
tipping point for the private sector to choose sukuk centres on its value proposition.
Chart 4.7: Malaysia’s Corporate Sukuk vs Conventional Outstanding (2006-June 2017)
0.00
100.00
200.00
300.00
400.00
500.00
600.00
700.00
2006
2007
2008
2009
2010
2011
2012
2013
2014
2015
2016 June 2017
RMbillion
Sukuk issuance
Conventional issuance
73
%
RM582.6
billion
RM232.5
billion
49
%
Source: BPAM
4.2.3
ANALYSIS OF SUKUK STRUCTURES, ISSUANCE AND INVESTMENT
Analysis of Sukuk Structures
From predominantly debt-based Shariah contracts in 2005 (refer to Chart 4.8), the market has
evolved through the last decade. Key developments include the establishment of Bursa Suq Al
Sila (BSAS) in August 2009, and the publication of the AAOIFI’s Shariah Standards in 2010.