


 20 / 59

COMCEC Poverty Outlook 2018
13
Upper-Middle Income OIC Member Countries
Human Development Index
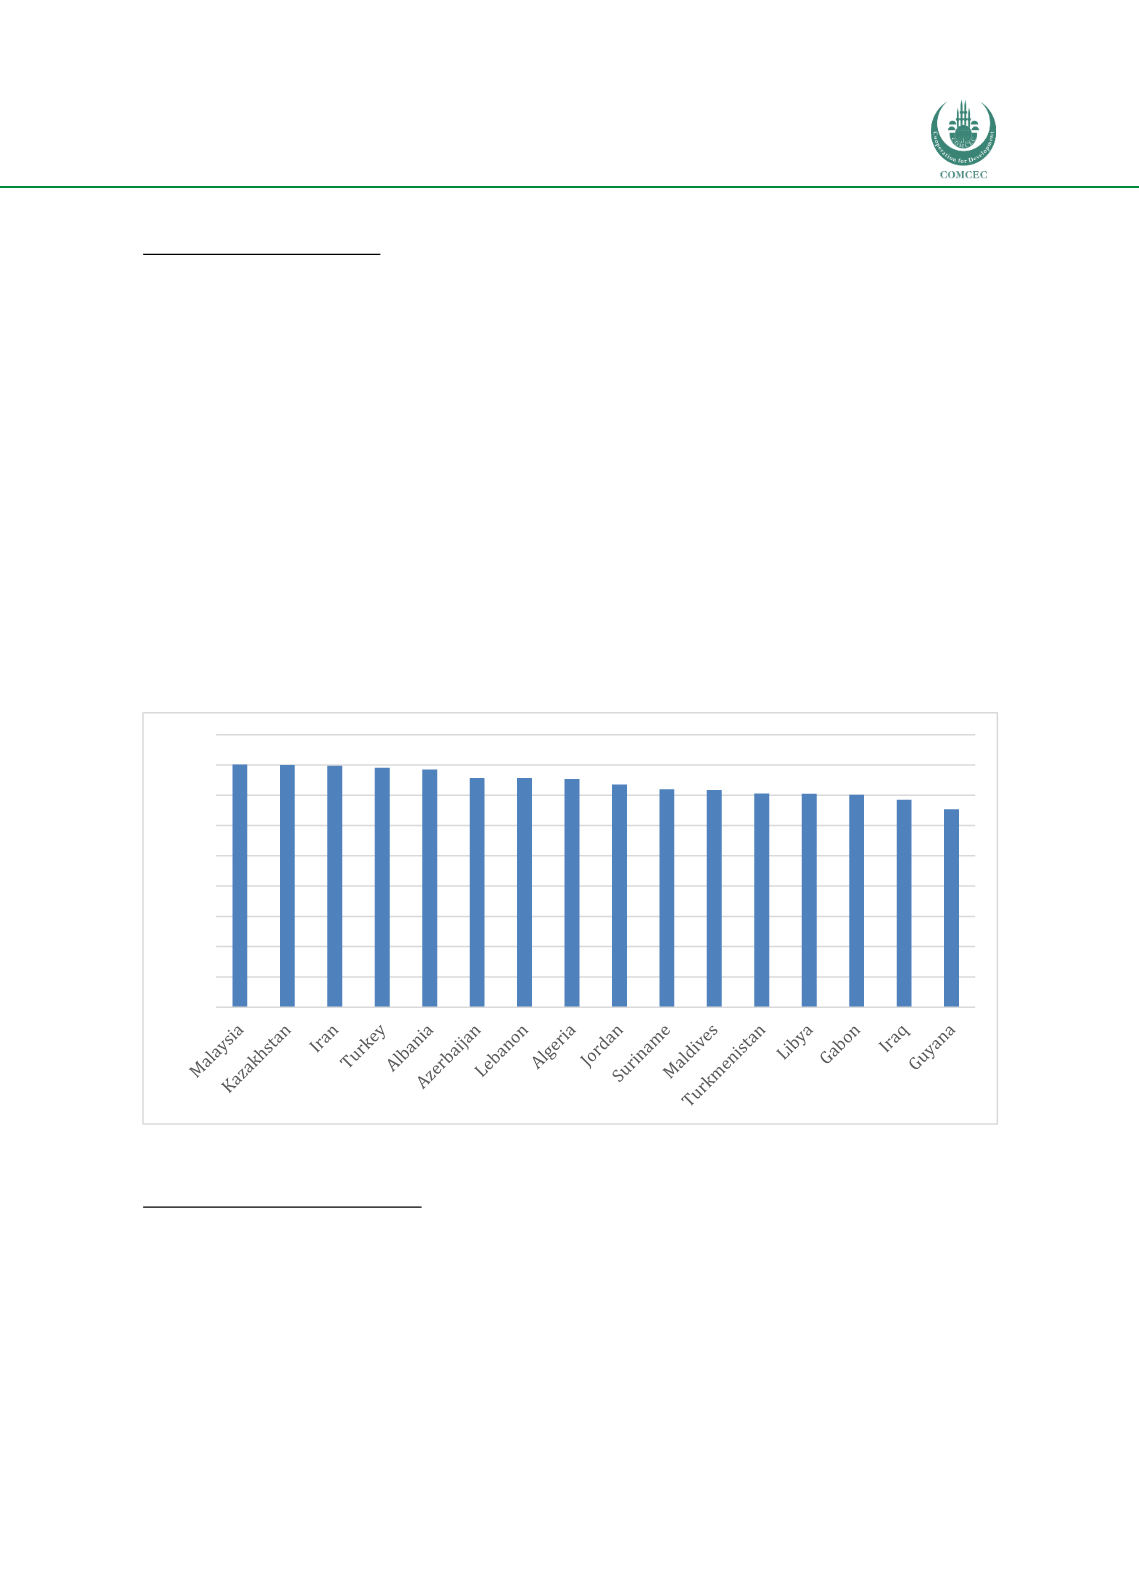
While 2 out of 16 upper-middle OIC income countries are in very high human development
category, 12 countries are in High Human Development (HHD) category and 2 countries are in
medium human development category
(Figure 14). Malaysia has the highest HDI value in this
group and positioned at 57 in the ranking, on the other hand, Guyana’s HDI value is the lowest
with 0.654 positioning at 125.
Index values for the first dimension of HDI, GNI per capita (2011, PPP, US$), are between US$7,447
(Guyana) and US$26,107 (Malaysia) for the upper-middle income countries of which nearly half
are above the average GNI value for the HHD category, which is US$14,999. Index values for the
second dimension, life expectancy at birth, are between 66.5 (Gabon) and 79.8 (Lebanon) of which
more than half are below the average life expectancy at birth value for the HHD category (76).
Regarding the third dimension, mean years of schooling, one third of the upper-middle income
OIC countries have an index value that is lower than the average HHD index value, which is 8.2,
and ranges between 6.3 (Maldives) and 11.8 (Kazakhstan). Lastly, regarding the fourth dimension,
expected years of schooling, the HDD index value is 14.1, and the countries index values range
between 10,8 (Turkmenistan) and 15,2 (Turkey).
Figure 14: HDI Values of Upper-Middle Income OIC Member Countries
Source: UNDP, 2018.
Multidimensional Poverty Index
Among upper-middle income countries, MPI is lowest in Kazakhstan (0.004) and highest in Gabon
(0.073). Indeed, while the multidimensional poverty rate is between 1 and 3 percent in
Kazakhstan, Albania, Libya, Maldives, Azerbaijan and Turkmenistan, it is more than 7 percent in
Suriname, Guyana, Iraq and Gabon. When the multidimensional poverty rates of these countries
compared to their monetary poverty rates, it is seen that the rates of population living in
multidimensional poverty exceed the rates of population living in income poverty
(Figure 6and
Figure 15).
0,802 0,800 0,798 0,791 0,785 0,757 0,757 0,754 0,735 0,720 0,717 0,706 0,706 0,702 0,685
0,654
0,000
0,100
0,200
0,300
0,400
0,500
0,600
0,700
0,800
0,900