


 21 / 59

COMCEC Poverty Outlook 2018
14
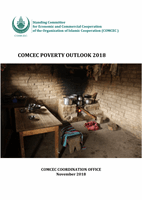
Figure 15: Multidimensional Poverty Rate in Upper-Middle Income OIC Member Countries (%)
Source: UNDP,2016.
Note: Index values for Algeria, Iran, Lebanon, Malaysia, Tunisia and Turkey are not calculated.
The contribution of deprivation in education to overall multidimensional poverty ranges between
4.3 (Kazakhstan) and 50.1 (Iraq), and the contribution of deprivation in living conditions ranges
between 10,1 (Turkmenistan) and 40.9 (Gabon), while the contribution of deprivation in health
is generally the highest which ranges between 37.2 (Suriname) and 83.9 (Kazakhstan).
State of Hunger
None of the upper-middle income countries are classified under low-income food-deficit
countries.
19
Most of the countries in this group have low or moderate levels of hunger
(Table 2).
Table 2: Global Hunger Index Values of Upper-Middle Income OIC Member Countries
Country
1990
1995
2000
2005
2016
Albania
21,4
19,1
21,1
17,1
11,9
Algeria
17,1
18,0
14,8
12,2
8,7
Azerbaijan
−
28,3
27,2
16,7
9,8
Gabon
23,2
20,8
18,5
16,2
12
Guyana
−
24,1
18,8
16,9
14,5
Iran
18,5
16,5
13,7
9,5
6,7
Iraq
17,4
24,3
24,9
23,6
22
Kazakhstan
−
15,4
10,7
12,3
7,8
Lebanon
12,1
9,4
9,0
10,4
7,1
Libya
−
−
−
−
−
Malaysia
20,4
17,4
15,5
14,6
9,7
Suriname
18,5
16,5
16,5
13,1
10,1
Turkey
14,5
13,4
10,5
7,6
<5
Turkmenistan
−
24,5
22,2
17,5
12,3
Source: IFPRI
et.al., 2016.
Note: Index value for Maldives is not calculated.
19
See Annex 5.
1,1
1,2
1,4
2,0
2,4
3,0
7,6
7,8
13,3
16,7
0,0
2,0
4,0
6,0
8,0
10,0
12,0
14,0
16,0
18,0