


 25 / 59

COMCEC Poverty Outlook 2018
18
Index values for the first dimension of HDI, GNI per capita (2011, PPP, US$), range between
US$906 (Niger) and US$3,317 (Tajikistan) in the low income group, and the GNI values of all the
countries in this group, except Tajikistan, are below the average GNI value for the LHD category
which is US$2,521. Regarding the second dimension, life expectancy at birth the index values are
between 52.2 (Sierra Leone) and 71,2 (Tajikistan). For the third dimension, mean years of
schooling, the index values of this group vary between 1.5 (Burkina Faso) and 10.4 (Tajikistan),
and only five countries (Tajikistan, Uganda, Syria, Comoros and Togo) have index values above
the LHD average value which is 4.7. Index values for the fourth dimension, expected years of
schooling, is the best among the HDI dimensions, since more than half of the low income countries
have an index value which is above the LHD average index value (9.4) ranging between 5.4 (Niger)
and 12.6 (Benin).
Multidimensional Poverty Index
MPI values for the low income OIC Member Countries are between 0.165 (Comoros) and 0.584
(Niger).
22
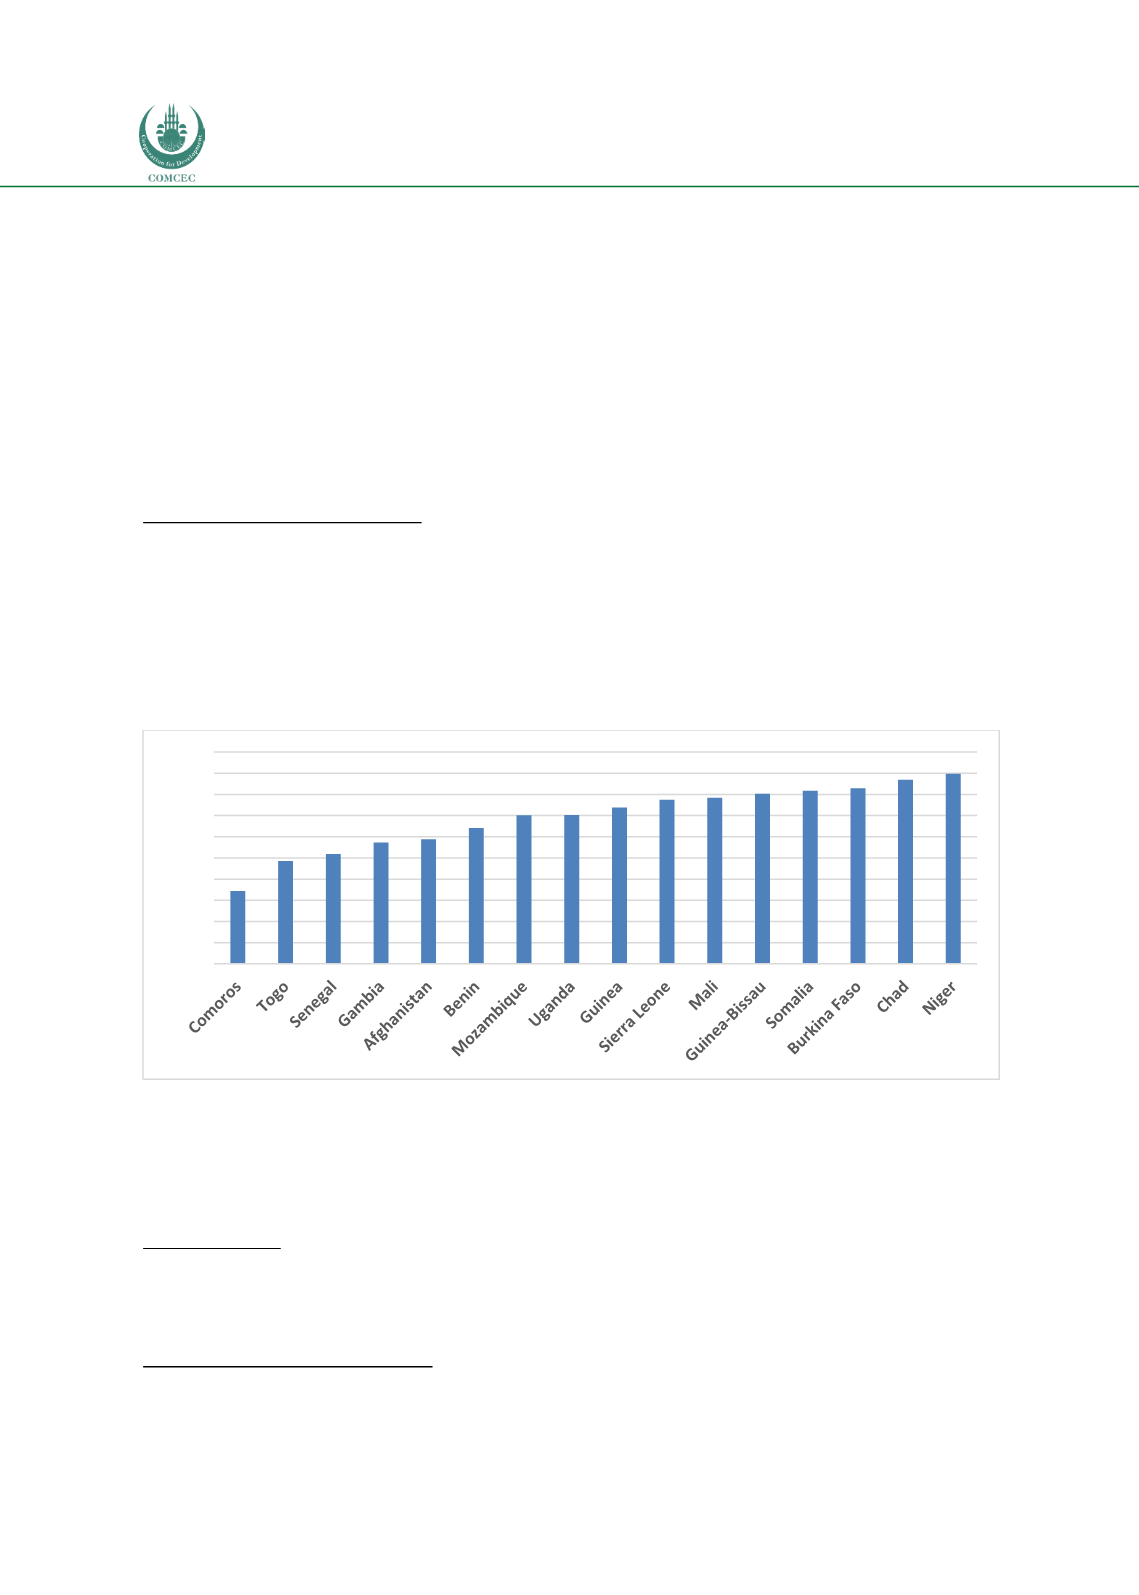
For all the countries Except Comoros and Togo in this income group, the rates of the
population inmultidimensional poverty are higher than 50 percent
(Figure 19). The highest share
belongs to Niger with almost 90 percent. The share of population in severe multidimensional
poverty ranges between 14.9 percent (Comoros) and 73.5 percent (Niger), and 6 out of 16 low
income OIC countries’ more than half of the population are in severe poverty.
Figure 19: Multidimensional Poverty Rate in Low Income OIC Member Countries
Source: UNDP, 2016.
The contribution of deprivation in education to overall multidimensional poverty ranges between
18 (Uganda) and 45.6 (Afghanistan), the contribution of deprivation in health ranges between
18.8 (Somalia) and 30.9 (the Gambia), and the contribution of deprivation in living conditions
ranges between 33.4 (Senegal) and 51.9 (Uganda).
State of Hunger
All the countries in the low income group are in the position of “low income food-deficit country”.
The GHI values of these countries ranged from 16.5 (Senegal) to 44.3 (Chad) in 2016. 11 out of 16
22
See Annex 8.
34,3
48,5 51,9
57,2 58,8
64,2
70,2 70,3 73,8 77,5 78,4 80,4 81,8 82,8 86,9 89,8
0,0
10,0
20,0
30,0
40,0
50,0
60,0
70,0
80,0
90,0
100,0