


 50 / 143

COMCEC Transport and Communications
Outlook 2019
30
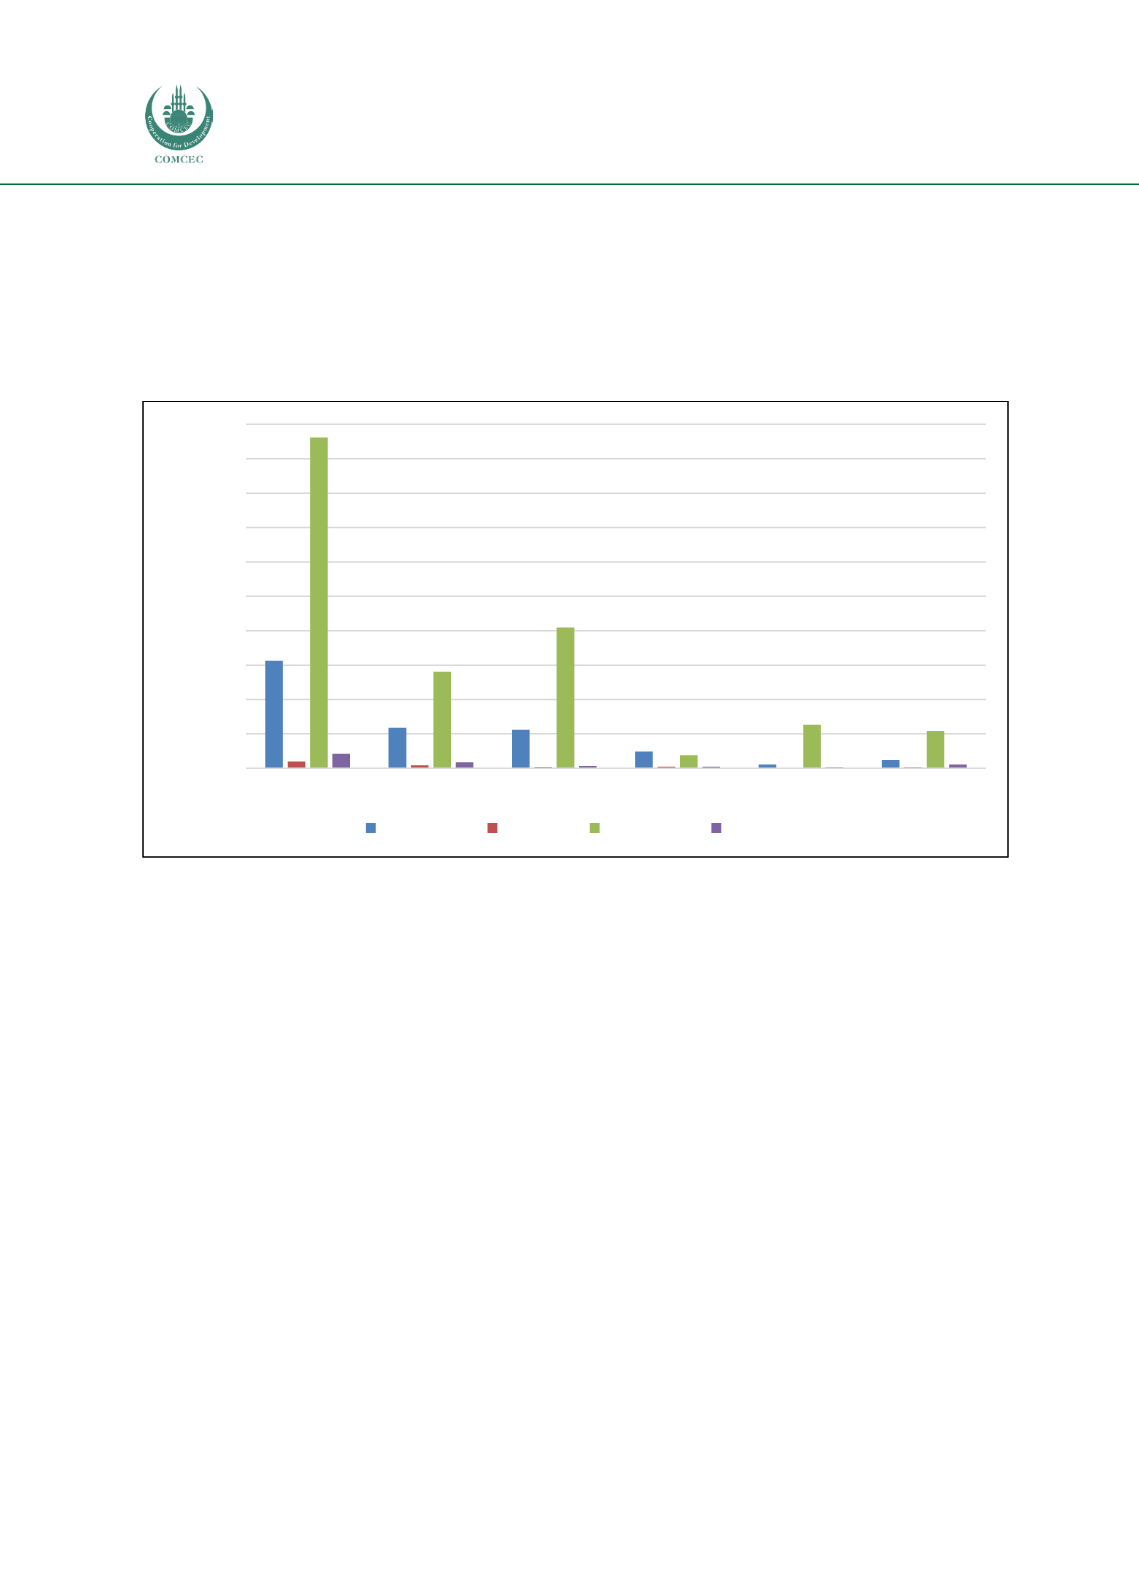
Figure 14 compares the share of OIC fleet in the global fleet by ship’s type in 1988 and 2018,
respectively. The figure reveals that the OIC’s share of general cargo ships is currently 13.1% of
the world’s general cargo fleet, while the OIC share in the global bulk and tanker fleet is only
1.7% and 6.0%, respectively. This is surprising considering the trade in many OIC countries are
mainly dominated by bulk and fuel commodities (COMCEC, 2015).
Figure 14: OIC and global commercial fleet by type of ship (1988 and 2018)
Source: Compiled by the author from UNCTAD Statistical Database
Table 8 presents the commercial fleet capacity of the OIC countries. Between OIC countries,
there is a great disparity in ship ownership and operation. In 2018, Indonesia had the largest
commercial OIC fleet capacitywith a total tonnage of 22.3million dwt. Other countries with large
fleets include Saudi Arabia (13.5 million dwt), Malaysia (10.2 million dwt), and Turkey (7.7
million dwt). At the other end of the scale, some OIC countries such as Afghanistan and Mali have
no commercial fleet while others like Benin and Somalia have negligible tonnage despite the
importance of their maritime trade related sectors.
0
200.000
400.000
600.000
800.000
1.000.000
1.200.000
1.400.000
1.600.000
1.800.000
2.000.000
Total fleet
Oil tankers
Bulk carriers General cargo Container ships Other types of
ships
World 1988 OIC 1988 World 2018 OIC 2018