


 40 / 113

COMCEC Trade Outlook 2017
34
F
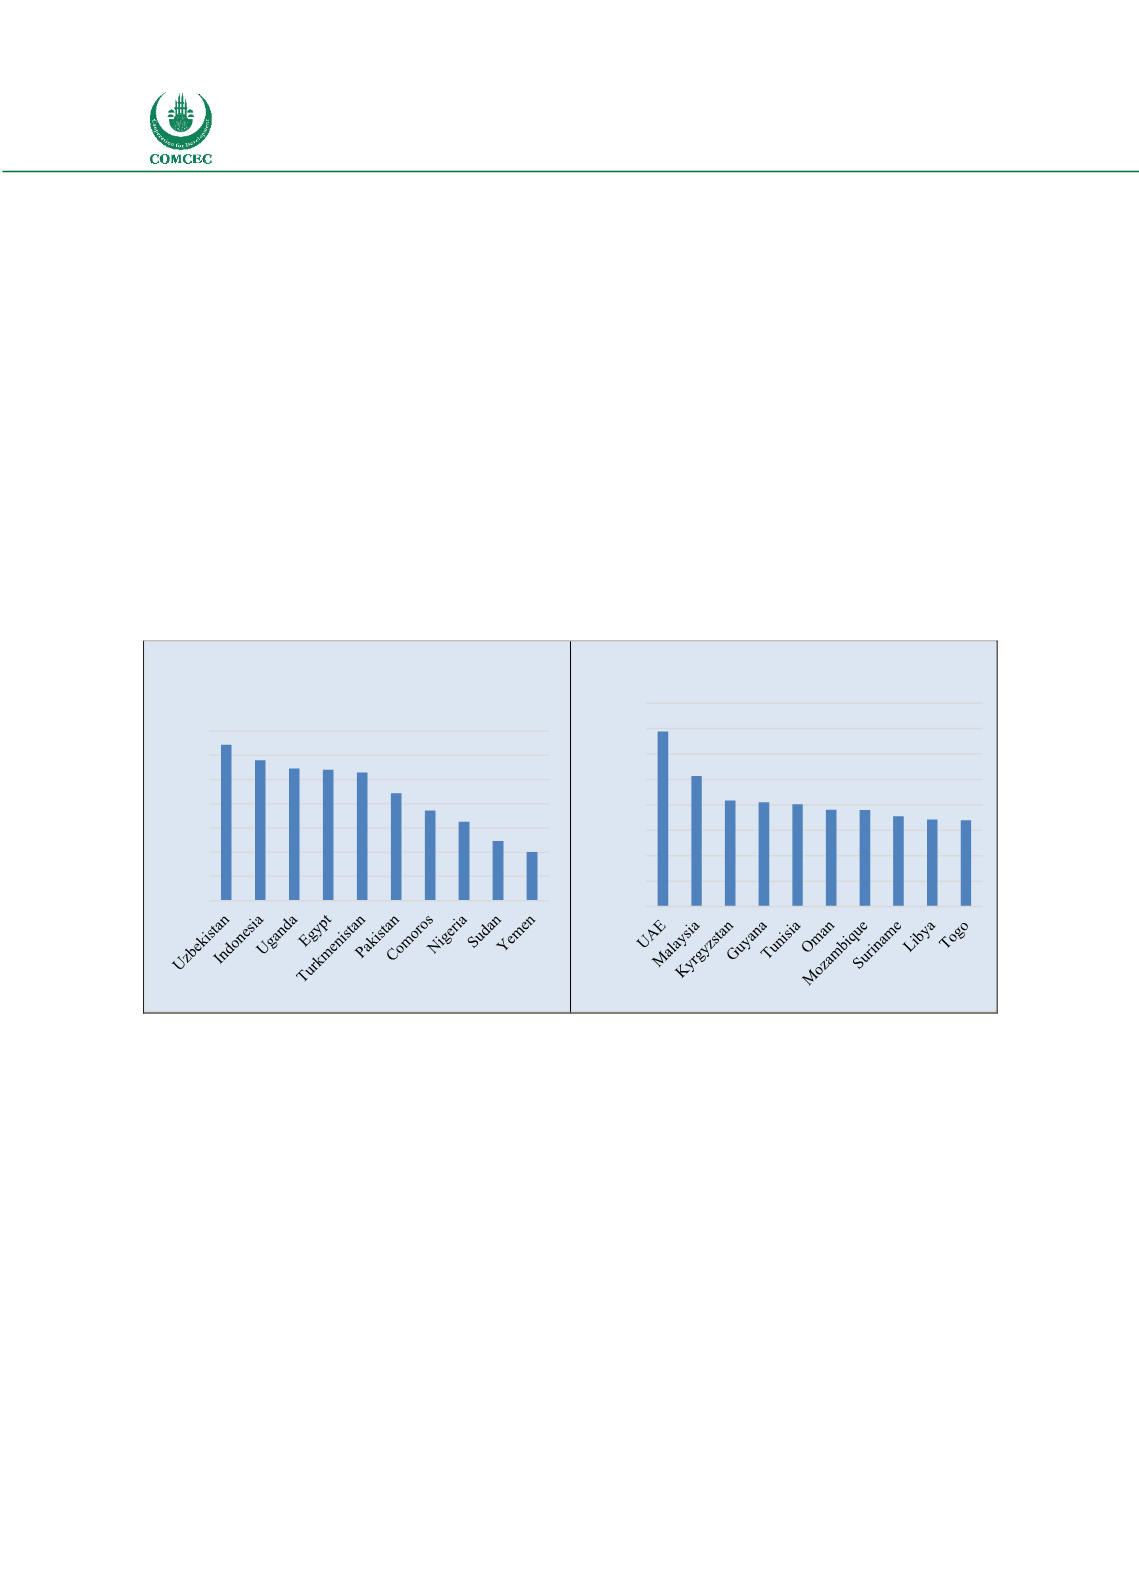
igure 40 shows top ten countries having the lowest and highest trade to GDP ratios in 2016.
United Arab Emirates had the highest share of trade in GDP with 138 per cent in 2016. On the
other hand, countries having the lowest trade to GDP ratios were Yemen, Sudan and Nigeria
where trade to GDP ratios ranged between 10 to 16 per cent. Some caution is needed in
interpreting the share of trade to GDP ratios. Because
t
he importance of trade is higher for small
countries (in terms of geographic size and population) than for the large, relatively self-
sufficient countries or those that have geographical disadvantage and high transport costs.
Moreover, several factors such as trade policy, economic structure, and the multinational firms
may account for the differences in this ratio (Love and Lattimore, 2009). On the other hand, as a
result of the undervaluation of local currencies in low and middle-income countries, the GDP
calculated on the basis of purchasing power parities is usually two to three times larger than
that calculated on the basis of current market exchange rates. Thus, the share of trade in GDP
may be biased and tend to be high in low and middle income countries (ICC OpenMarkets Index,
2013). This could explain why the ratio of trade is quite high in some LDCs of the OIC like
Mauritania.
Figure 40: Member States Having the Lowest and Highest Openness Ratios in 2016
Source: UNCTADSTAT
Trade Facilitation:
Trade Facilitation aims at easing the trade among the
countries through decreasing the burden of procedures and
trade costs. Firms face various costs when trading
internationally. Issues including export and import
procedures, customs formalities, transportation and logistics
problems may increase trade costs. Studies, such as WTO
(2004) and De (2009) suggest that higher transport costs is in many cases more restrictive to
trade than high tariffs.
Various studies have been conducted to measure the impact of transport constraints on
international trade. For example, based on their research on Middle East and North Africa
(MENA) region, Bhattacharya and Hirut (2010) suggest that reducing the transport constraint
0
5
10
15
20
25
30
35
Per cent
Member States Having the Lowest
Openness Ratio
0
20
40
60
80
100
120
140
160
Per cent
Member States Having the Highest
Openness Ratio
“Trade Costs are
higher in Landlocked
Member States”