
COMCEC Trade Outlook 2016
26
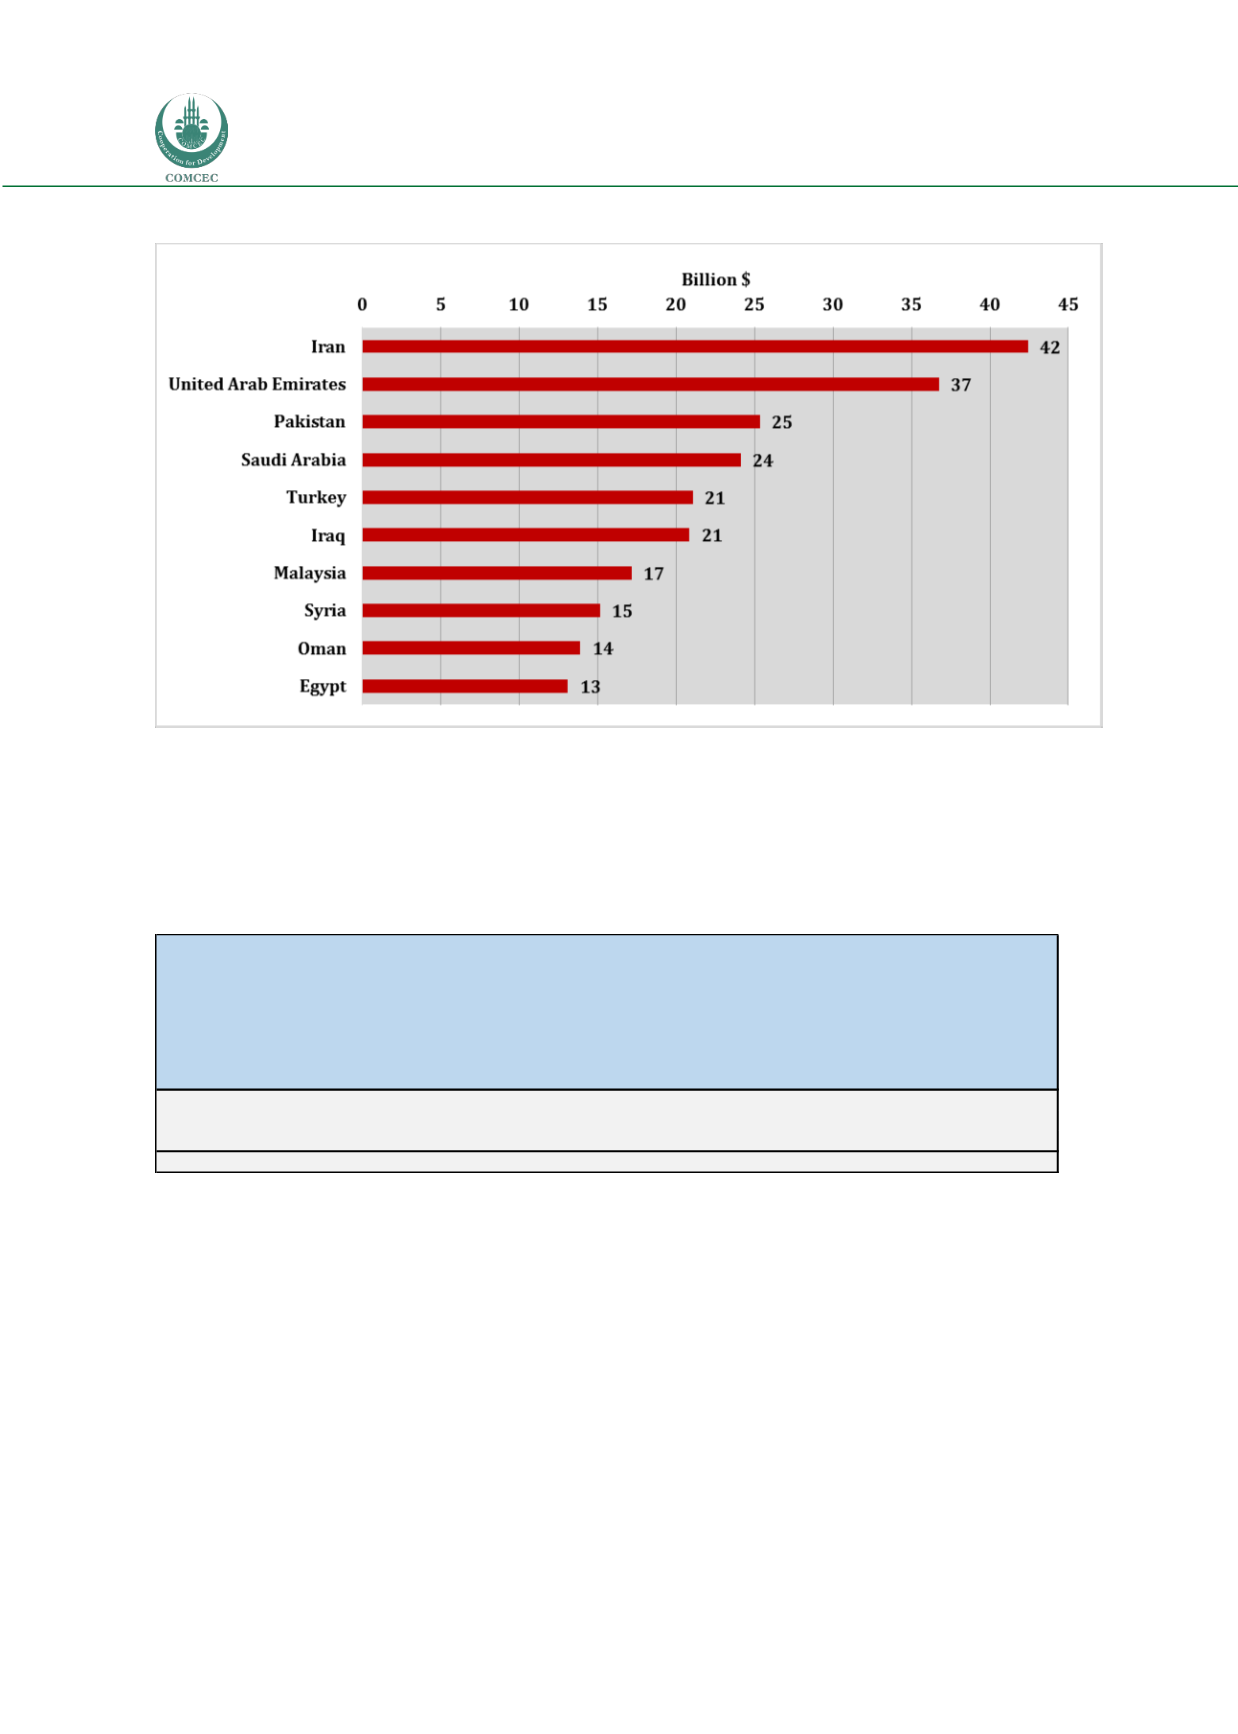
Figure 27: Intra OIC Imports in 2015
Source: IMF Direction of Trade Statistics
The commodity composition of intra-OIC imports according to SITC Rev 3 classification by
regions could be observed from Table 7. In Arab and Asia regions, manufactured goods has the
highest share while mineral fuels, lubricants and related material has the highest share in intra-
imports of Africa amounting to 40.4 per cent.
Table 7: Commodity Composition of Intra-OIC Imports by Sub-Regions (% Shares, 2015)
Source: UNCTADSTAT
The third Extra-Ordinary Islamic Summit Conference
held in 2005 in Makkah, Saudi Arabia set the target of 20
percent intra-OIC trade by 2015. The intra-OIC trade
target level was met by 20 percent intra-OIC trade in
2015. However, there is a great diversity among the
Member States with regards to achieving the 20 percent
target individually.
In 2015, the share of intra-OIC trade of 30 members
stayed above 20 percent in their total trade. However, in some of the Member States total trade
far surpassed the 20 percent. For example the share of intra-OIC trade was 88.8 percent in Syria,
followed by Afghanistan (60.4 percent) and Somalia (56.1 percent). On the other hand, the share
Food
and live
animals
Beverages
and
tobacco
Crude
materials
, inedible,
except
fuels
Mineral
fuels,
lubricants
and
related
materials
Animal
and
vegetabl
e oils,
fats and
waxes
Chemicals
and
related
products,
n.e.s.
Other
Manufactured
goods
Machinery
and
transport
equipment
Miscellaneous
manufactured
articles
Commodities
and
transactions,
n.e.s.
TOTAL
Arab
11.4
1.1
2.6
7.1
0.8
8.9
16.5
36.5
11.5
3.6 49.6
Asia
6.8
0.7
4.9
10.8
1.3
12.1
16.8
34.8
6.9
4.8 44.1
Africa
12.7
1.7
1.7
15.3
1.3
11.2
16.1
31.6
7.8
0.3
6.3
TOTAL
9.5
1.0
3.6
9.3
1.1
10.5
16.6
35.5
9.2
3.9 100.0
“20 percent intra-OIC
trade target was
surpassed by 30 Member
States in 2015 ”


