
COMCEC Trade Outlook 2016
25
Although the sectorial breakdown of intra-OIC exports is similar to that of total OIC exports
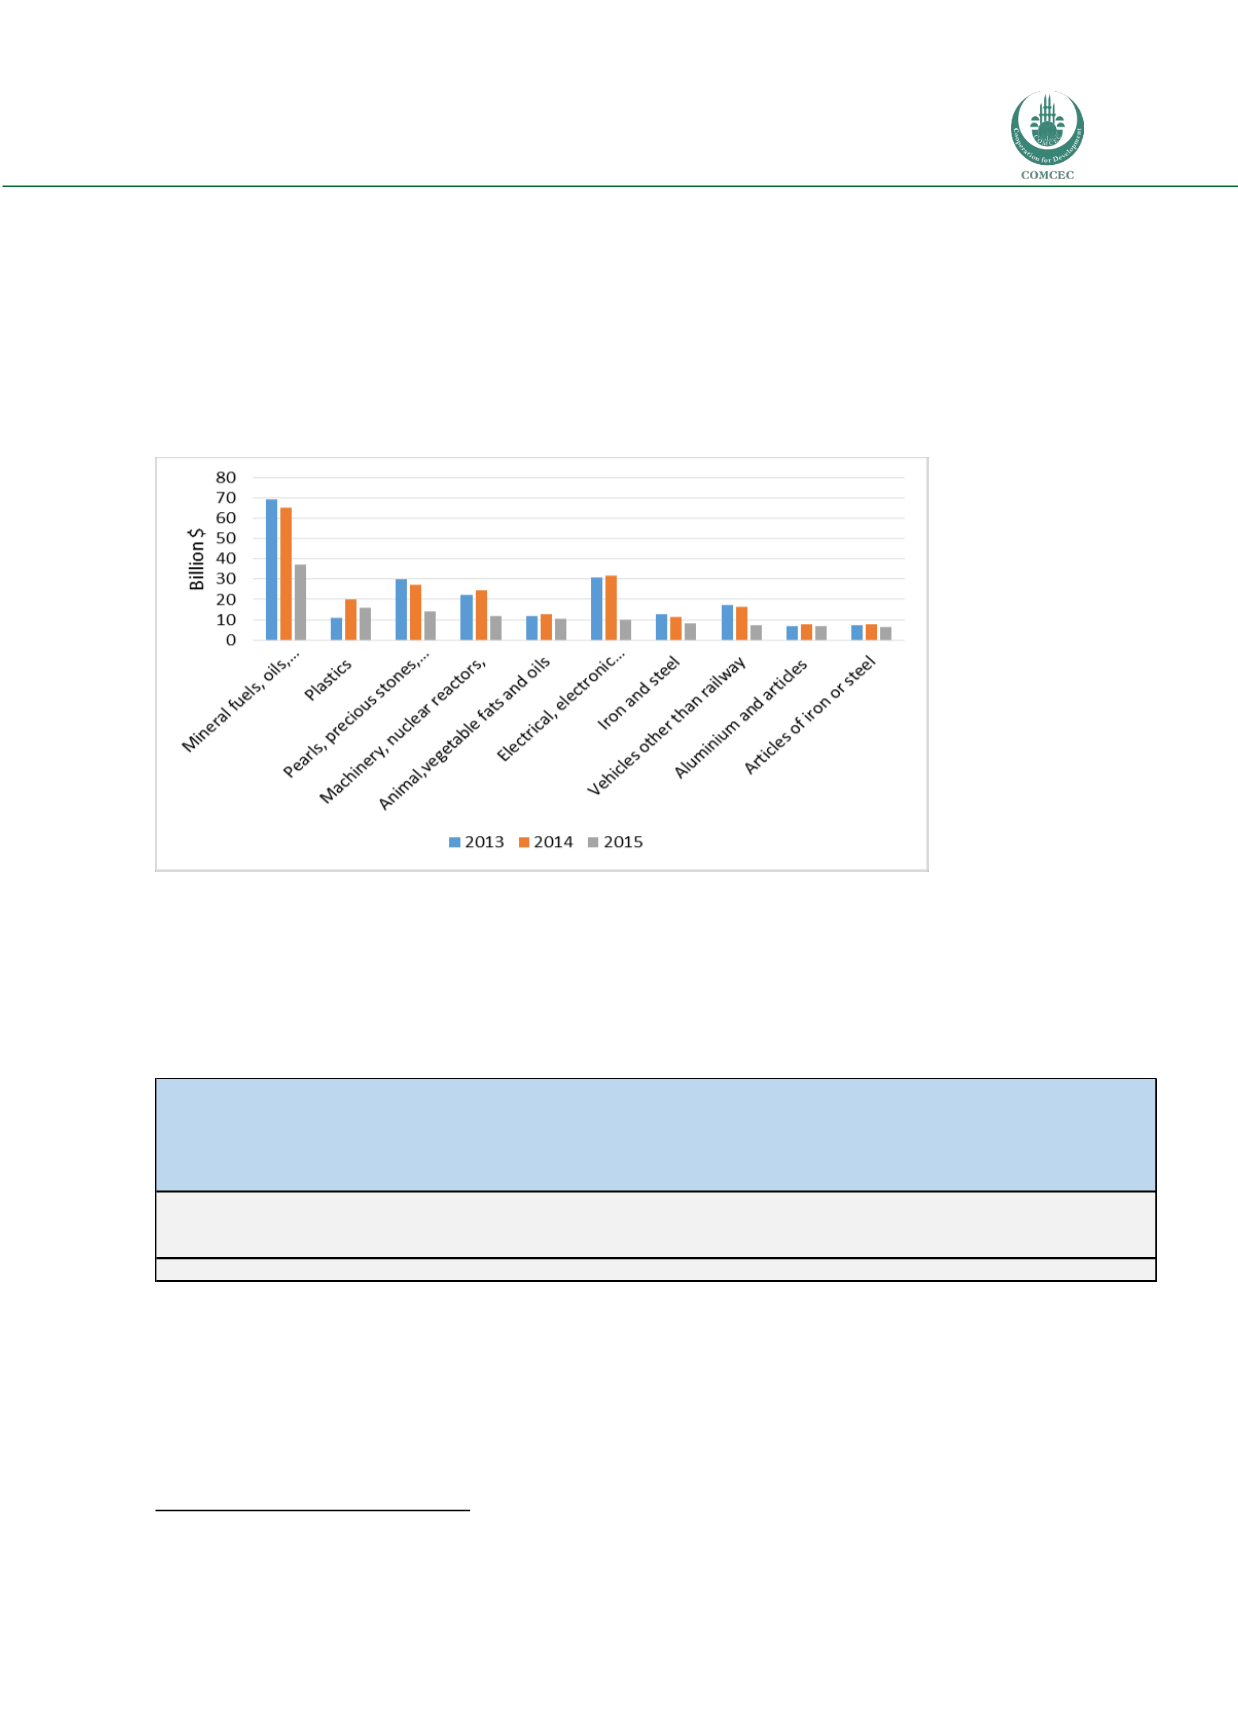
being dominated by mineral fuels, its share is not as high as in total exports (Figure 26). Of the
total intra-OIC exports, share of mineral fuels, oils and related products was 16.5 per cent,
followed by plastics and articles with 7.1 per cent, pearls, precious stones, contributing 6.1
percent and machinery and nuclear reactors with 5.2 per cent. In 2015 intra OIC exports
declined in almost all sectors but the contribution of mineral fuels and oils to this decline was
the biggest due to fall in oil prices in this year.
Figure 26: Evolution of Intra OIC Exports by Top 10 Items
Source: ITC Trade map
The structure of the intra-OIC exports also varies according to the three geographical regions of
the OIC (Arab, Asia and Africa)
11
. The mineral fuels and related products had the highest share
in Africa’s intra exports while the share of manufactured goods was highest in Asia regions’ intra
exports. (See Table 6).
Table 6: Commodity Composition of Intra-OIC Exports by Sub-Regions (% Shares, 2015)
Source: UNCTADSTAT
3.2.
INTRA-OIC IMPORTS
The intra-OIC imports of Iran had the highest share in total intra OIC imports with 12.2 percent
followed by United Arab Emirates with 10.3 per cent and Pakistan with 7.3 per cent in 2015.
11
The list of countries by the regions provided in Appendix 1.
Food and live
animals
Beverages
and tobacco
Crude
materials,
inedible,
except
fuels
Mineral
fuels,
lubricants
and
related
materials
Animal
and
vegetable
oils, fats
and waxes
Chemicals
and related
products,
n.e.s.
Other
Manufactured
goods
Machinery
and
transport
equipment
Miscellaneous
manufactured
articles
Commodities
and
transactions,
n.e.s.
TOTAL
Arab
3.3
0.7
1.9 58.5
0.3 10.5
8.1
9.4
4.3
2.9 50.5
Asia
6.5
0.6
4.5 24.7
4.7
6.7
13.9 21.1
14.3
3.0 43.5
Africa
11.6
1.2
9.6 62.4
0.6
1.7
4.3
2.7
1.3
4.6
5.9
TOTAL
5.2
0.7
3.5 44.0
2.2
8.3
10.4 14.1
8.5
3.1 100.0


