
COMCEC Trade Outlook 2016
31
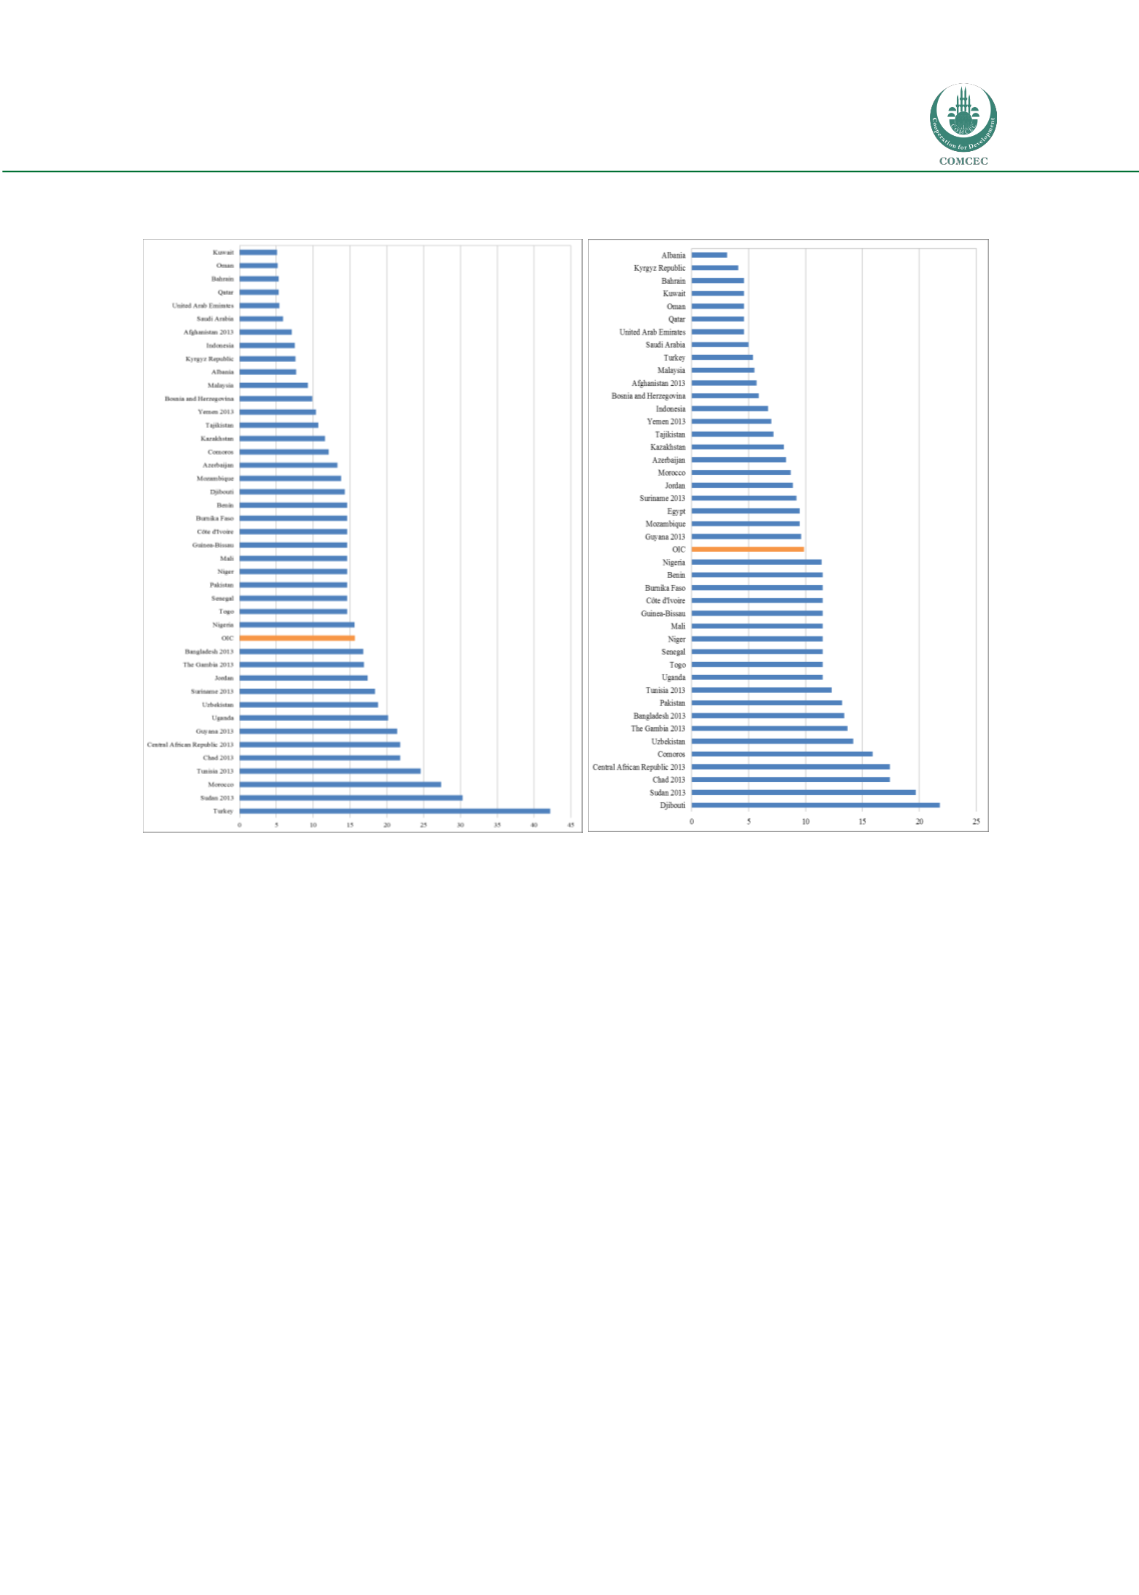
Figure 34: Simple Average Applied Tariffs on Agricultural Figure 35: Simple Average Applied Tariffs on Non-Agricultural
Products in OIC Member States (percent-2014)* Products in OIC Member States (percent-2014)*
Source: WTO Statistics/* Due to lack of data 2014 figures were used for some member states
Trade Openness in the OIC
One of the most common measure of openness is to evaluate the ratio of trade (the sum of value
of exports and imports of goods) to the gross domestic product (GDP). This could be interpreted
as the relative importance of trade to the economy.
Figure 36 shows the difference between the trade to GDP ratios in percentage points between
2005 and 2014. As it could be followed from the Figure, the importance of trade has risen in
many OIC member states in the last decade and trade has become one of the most important
sources of growth. The countries which have realized the highest increase in the trade to GDP
ratio were United Arab Emirates, Sierra Leone and Kyrgyzstan. The trade to GDP ratio in total
OIC decreased from 64.1 per cent in 2005 to 60.2 per cent in 2014.
F
igure 37 shows top ten countries having the lowest and highest trade to GDP ratios in 2014.
United Arab Emirates had the highest share of trade in GDP with 150.6 per cent in 2014. On the
other hand, countries having the lowest trade to GDP ratios were Sudan, Nigeria and Pakistan.
Some caution is needed in interpreting the share of trade to GDP ratios. Because
t
he importance
of trade is higher for small countries (in terms of geographic size and population) than for the
large, relatively self-sufficient countries or those that have geographical disadvantage and high
transport costs.


