
COMCEC Trade Outlook 2016
23
3.
INTRA-OIC TRADE
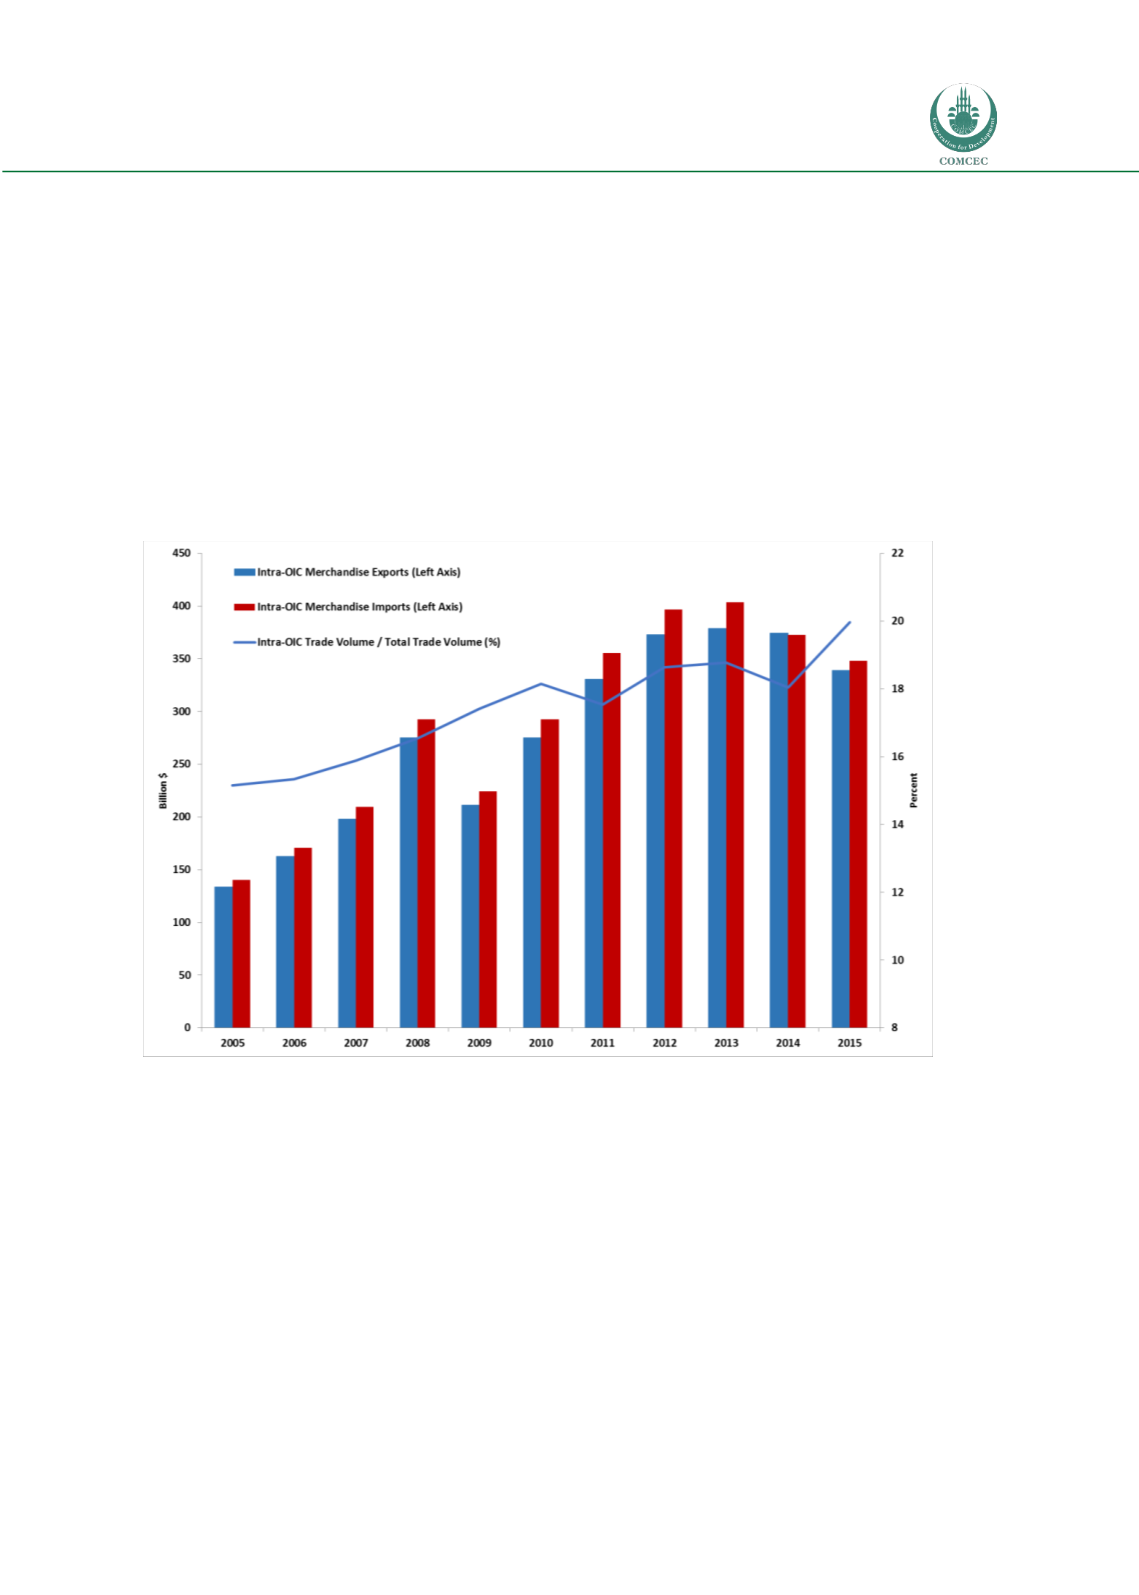
Recovering from the global crisis in 2010, the intra-OIC trade (average of intra-OIC exports and
intra-OIC imports) continued to increase in the following years and peaked at 391 billion dollars
in 2013. However intra-OIC trade has been declining since then. The fall in intra OIC trade is
more prominent in 2015 when it fell by 9.2 per cent to 354 billion dollars.
The share of intra-OIC trade in total trade remained roughly constant between 2012 and 2014
averaging 18.5 per cent. However the share of intra-OIC trade increased by 1.9 points to 20 per
cent in 2015 thus the long-sought target of 20 percent intra-OIC trade level has been met in
2015. In 2015, intra-OIC exports accounted for 21.1 percent of total OIC exports while intra OIC
imports accounted for 19 percent of total OIC imports.
Figure 23: Intra-OIC Trade
Source: IMF Direction of Trade Statistics
Among the top ten leading countries in intra-OIC trade in 2015, United Arab Emirates ranked
first followed by Saudi Arabia, Turkey, Iran, Malaysia, Pakistan, Indonesia, Syria, Oman and Iraq.
Top ten countries accounted for the 70 per cent of the intra-OIC trade (see Figure 24).


