
COMCEC Trade Outlook 2016
32
Moreover, several factors such as trade policy, economic structure, and the multinational firms
may account for the differences in this ratio (Love and Lattimore, 2009). On the other hand, as a
result of the undervaluation of local currencies in low and middle-income countries, the GDP
calculated on the basis of purchasing power parities is usually two to three times larger than
that calculated on the basis of current market exchange rates. Thus, the share of trade in GDP
may be biased and tend to be high in low and middle income countries (ICC OpenMarkets Index,
2013). This could explain why the ratio of trade is quite high in some LDCs of the OIC like
Mauritania.
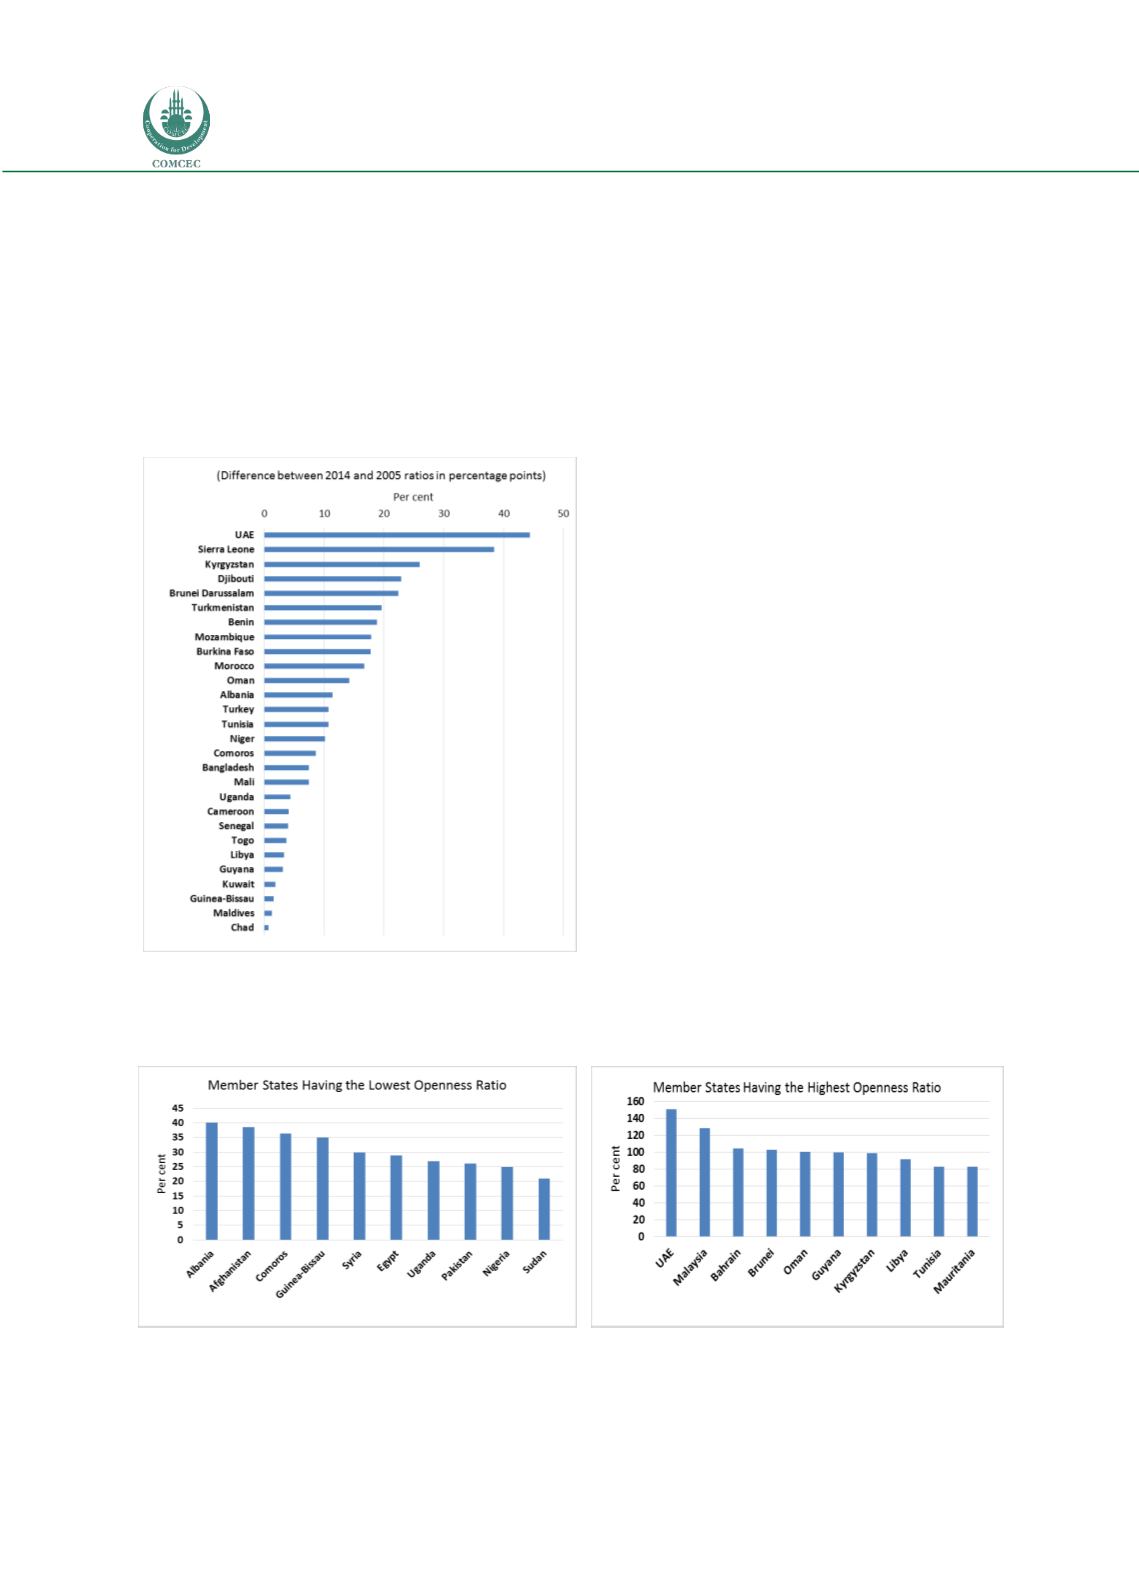
Figure 36: Share of Trade in GDP in OIC Member States
Source: UNCTADSTAT
Note: Those countries which have the positive difference and data were included.
Figure 37: Member States Having the Highest and Lowest Openness Ratios in 2014
Source: UNCTADSTAT


