
COMCEC Trade Outlook 2016
20
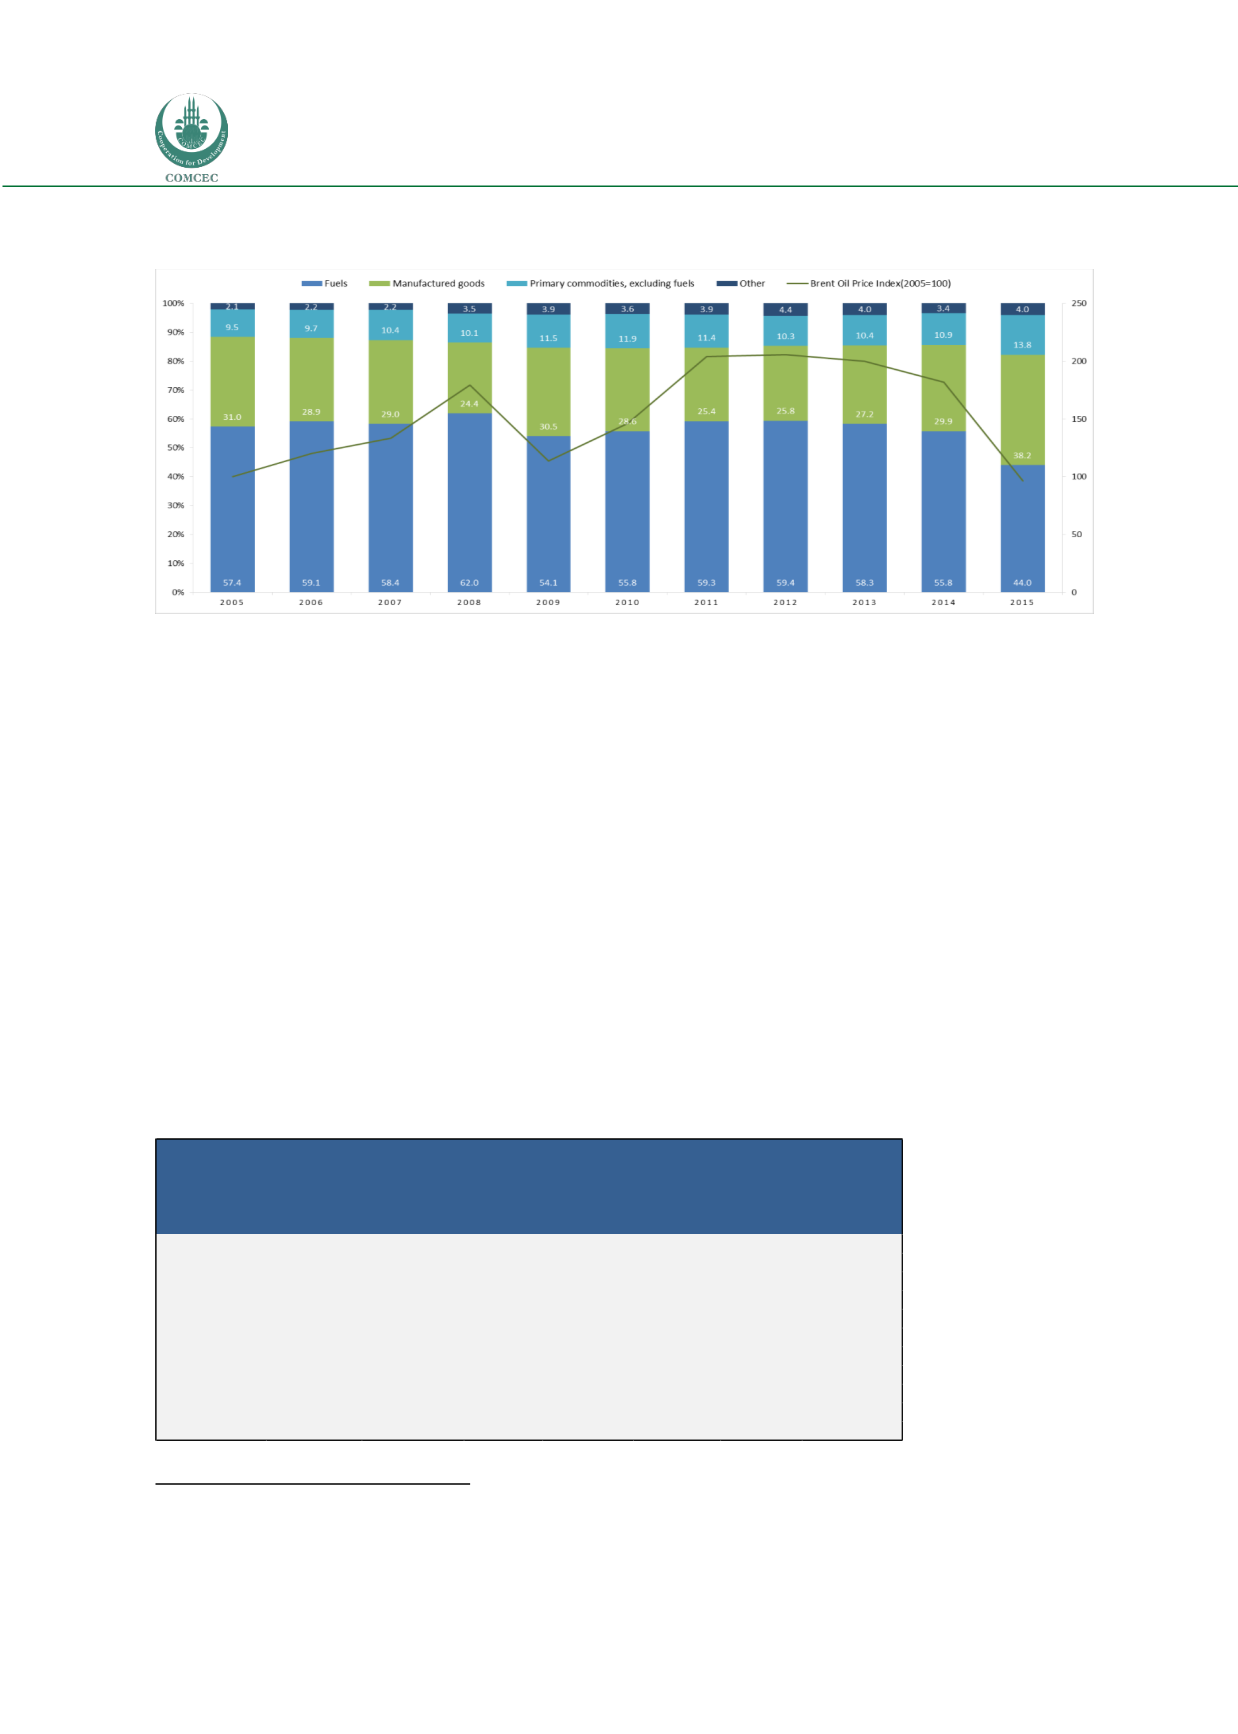
Figure 19: Evolution of OIC Exports by SITC Rev 3 Product Groups (per cent) versus Oil Price
(dollars per barrel)
Source: UNCTADSTAT
Table 4 provides the details of the largest
manufactured goods exporters of OIC by degree of
manufacturing in 2015. Malaysia, Turkey, United Arab
Emirates and Indonesia as being the largest
manufactured goods exporters realized as a whole 65
per cent of OIC manufactured goods exports. Labor-
intensive and resource-intensive manufactures make
up 97 per cent of the manufactured exports in
Bangladesh and 86 per cent in Pakistan. This is due to
the high share of textile fibers, yarn, fabrics and
clothing in total manufacturing exports in Bangladesh and Pakistan. The share of high-skill and
technology-intensive manufactures in Saudi Arabia, Iran and Malaysia ranges between 64 to 81
per cent. When looked into detail of the manufacturing exports the share of chemical products
is 78 per cent and 66 per cent in Saudi Arabia and Iran respectively whereas share of machinery
and transport equipment is 63 per cent in Malaysia.
Table 4: Largest Manufactures Exporters by Degree of Manufacturing
10
, 2015 (per cent)
Source: UNCTADSTAT
10
Classification of products by degree of manufacturing is available in UNCTADstat,
http://unctadstat.unctad.org/EN/Classifications.htmlShare of
Manufacturing in
Total OIC
Manufacturing
Share of
Manufacturing in
Country's Total
Exports
Manufactured
goods by
degree of
manufacturing
Labour-
intensive and
resource-
intensive
manufactures
Low-skill and
technology-
intensive
manufactures
Medium-skill
and
technology-
intensive
manufactures
High-skill and
technology-
intensive
manufactures
Malaysia
21.3
66.4
100.0
10.3
5.2
20.1
64.4
Turkey
17.2
74.7
100.0
33.0
14.4
37.7
14.9
UAE
16.3
37.9
100.0
9.2
9.5
29.7
51.6
Indonesia
10.5
43.9
100.0
38.0
8.5
25.0
28.5
Saudi Arabia
8.7
27.0
100.0
5.4
7.0
6.8
80.7
Bangladesh
4.8
93.5
100.0
97.3
0.8
0.6
1.3
Pakistan
2.7
76.1
100.0
85.9
2.1
3.9
8.1
Iran
2.5
25.2
100.0
8.2
11.5
11.9
68.5
Morocco
2.4
67.6
100.0
33.2
2.2
33.4
31.3
Tunisia
1.8
79.8
100.0
33.6
5.6
36.0
24.8
“High technology
manufactures make up
43 per cent of OIC
manufactured goods
exports”


