
COMCEC Trade Outlook 2016
16
The OIC export markets are highly concentrated (Table 3).
Although 13.2 per cent of extra-OIC exports destined to
China, OIC exports are mainly shipped to developed
countries in recent years. The top ten countries accounts for
66 per cent of extra-OIC exports. This points to a high
country concentration in total OIC exports which makes OIC countries vulnerable to external
shocks that might result from decreasing demand in these countries and/or falling commodity
prices.
Table 3: Major Destinations of Total Extra-OIC Exports
Source: UNCTADSTAT
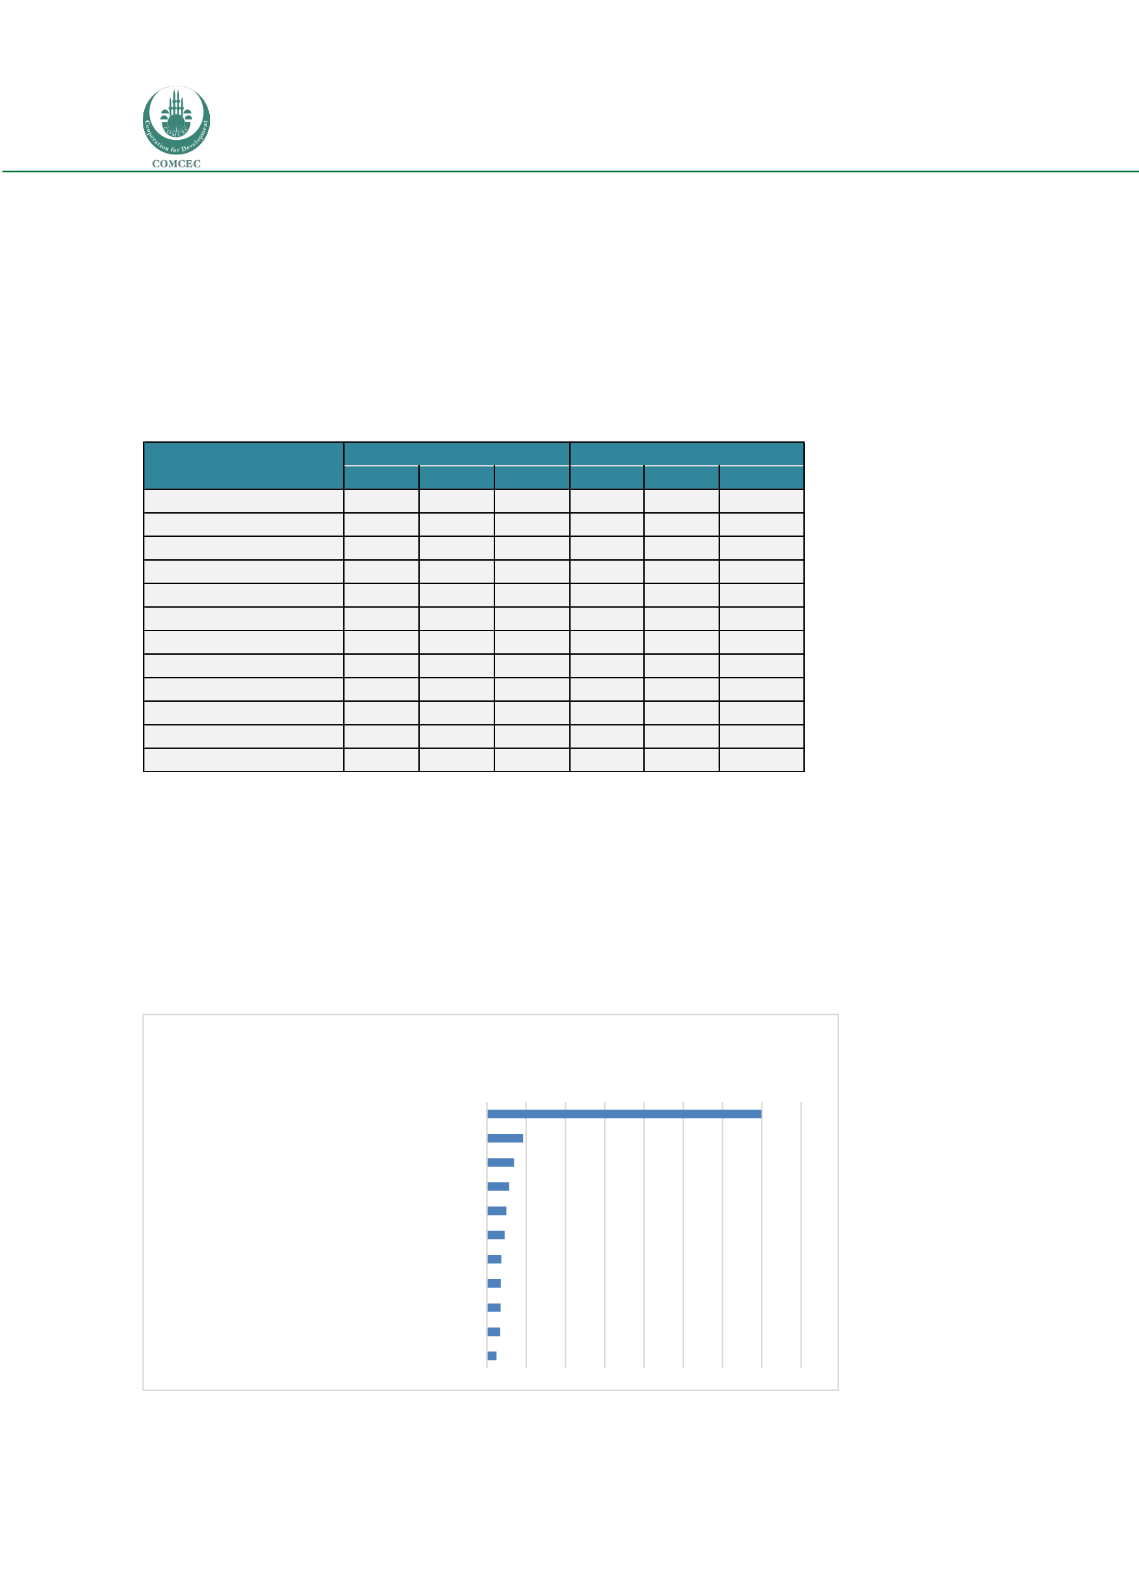
Total OIC exports are highly concentrated. The share of
mineral fuels, oils and distillation products in OIC exports
is 47.4 percent in 2015. This is followed by electrical
electronic equipment, articles of apparel, pearls, precious
stones and machinery. These five sectors as a whole
account for 66 per cent of total OIC exports. (Figure 14)
Figure 14: OIC Exports to World- Top 10 Items
Source: ITC Trade map
Countries
2013 2014 2015 2013 2014
2015
China
257
251
168 13.0
13.3
13.2
India
190
177
120
9.6
9.4
9.4
Japan
234
217
117 11.8
11.5
9.2
United States
162
147
99
8.2
7.8
7.8
Korea, Republic of
152
145
81
7.7
7.7
6.4
Singapore
99
99
66
5.0
5.3
5.2
Taiwan
95
90
63
4.8
4.8
4.9
Italy
87
75
50
4.4
4.0
3.9
France
62
60
42
3.2
3.2
3.3
Germany
52
50
41
2.6
2.6
3.2
EU 28
448
429
312 22.7
22.8
24.4
Total of Top Ten Countries
1839 1312
849 70.3
69.5
66.4
(Billion $)
Share %
0 100 200 300 400 500 600 700 800
Mineral fuels, oils, distillation…
Electrical, electronic equipment
Articles of apperel
Pearls, precious stones, metals, coins, etc
Machinery, nuclear reactors, boilers, etc
Plastics and articles thereof
Vehicles other than railway, tramway
Articles of apparel, accessories, knit or…
Animal,vegetable fats and oils,…
Articles of apparel, accessories, not…
Organic chemicals
Billion $
“The country
concentration of total
OIC exports is high”
“OIC exports are
dominated by mineral
fuels and oils”


