


 37 / 133

COMCEC Trade Outlook 2018
29
Despite its importance for economies, the commercial services trade is dominated by a few
countries in the world. As the table below figures out, the top ten exporter of the commercial
services trade had a share of more than 50 per cent in global commercial services exports in
2017.
Table 6: Top Commercial Services Exporters in the World
Countries
(Billion Dollars)
Share %
2015
2016
2017
2015
2016
2017
USA
732.0
733.6
761.7
15.1
15.0
14.4
UK
345.0
327.9
347.3
7.1
6.7
6.6
Germany
267.9
276.3
299.8
5.5
5.6
5.7
France
239.3
234.6
248.2
4.9
4.8
4.7
China
217.6
208.3
226.4
4.5
4.3
4.3
Netherlands
199.1
187.3
216.5
4.1
3.8
4.1
Ireland
139.6
155.5
186.1
2.9
3.2
3.5
India
155.7
161.2
183.4
3.2
3.3
3.5
Japan
158.3
168.8
180.0
3.3
3.5
3.4
Singapore
155.0
157.7
164.4
3.2
3.2
3.1
Top Ten Countries Total
2,609.4
2,611.3
2,813.9
53.7
53.4
53.3
World Total
4,863.5
4,893.3
5,279.4
100.0
100.0
100.0
Source: UNCTADSTAT
4.2. Trade in Commercial Services in the OIC Member Countries
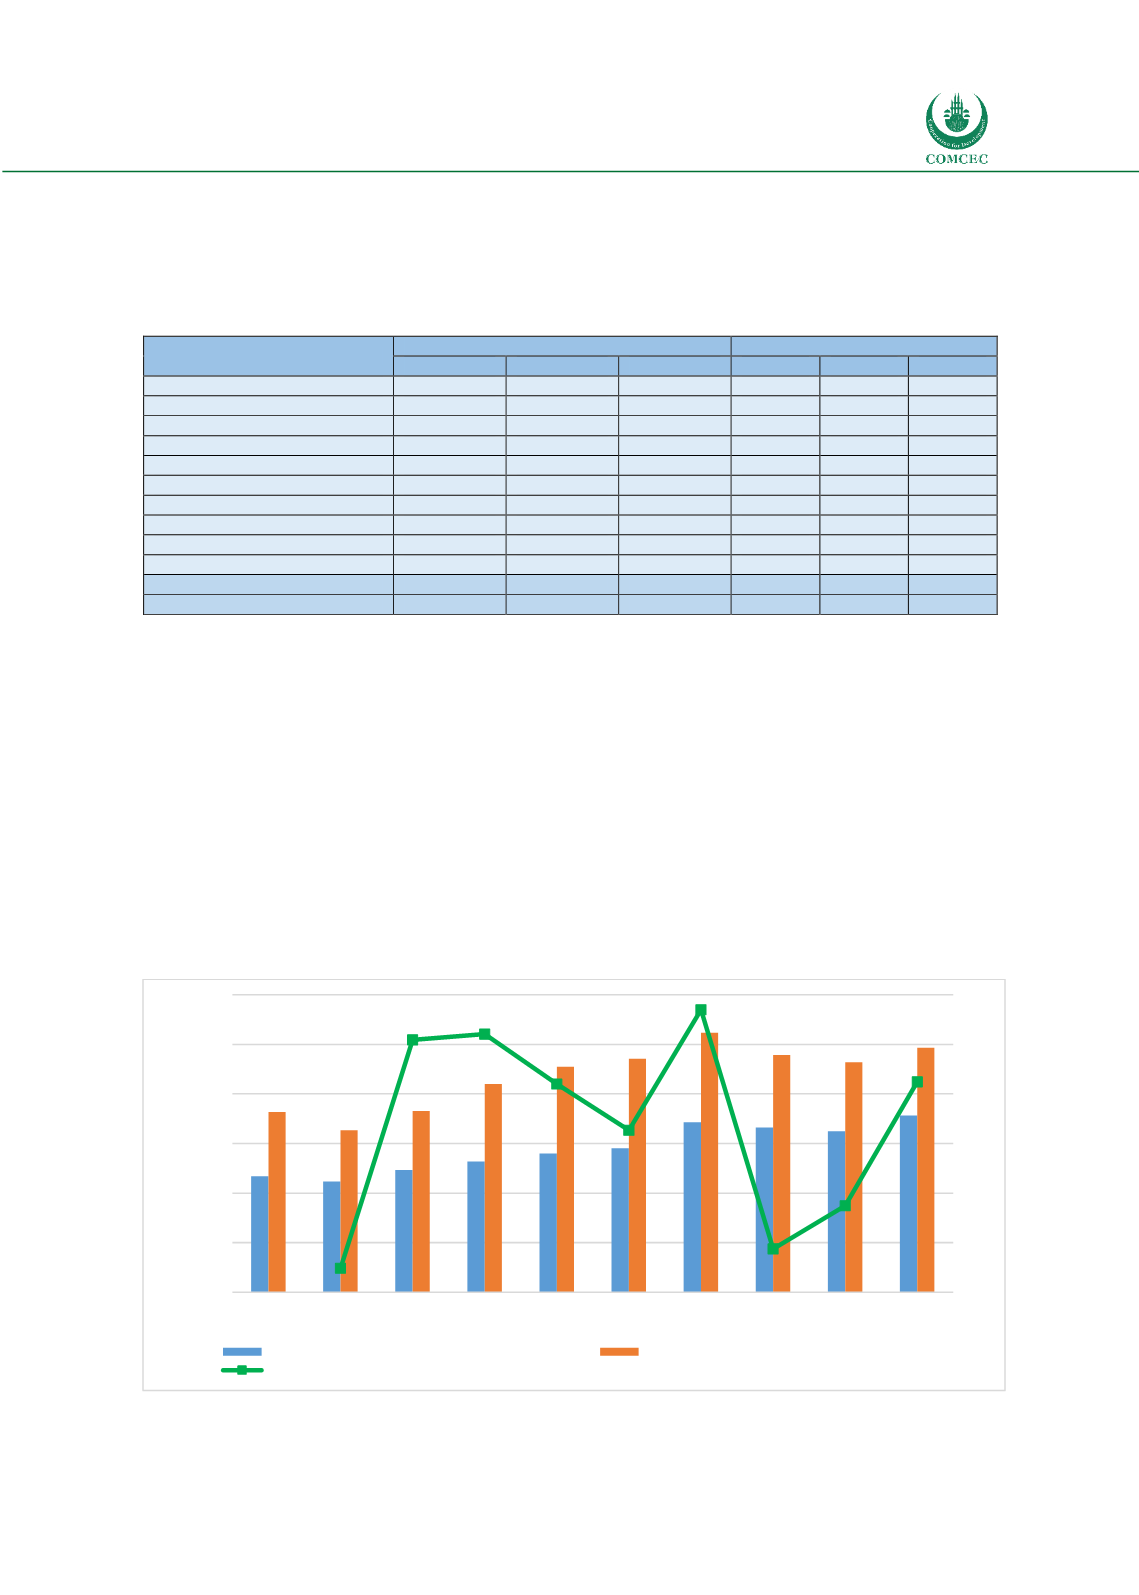
Total commercial services trade in the OIC reached its peak level in 2014 and recorded as 866
billion USD but it remained weak in 2015 and 2016. However total commercial services trade in
the OIC increased by 7.7 per cent and amounted to 849.6 billion USD in 2017.
With respect to the structure of the trade in services, OIC services imports has dominated the
services exports in the last decade. Accordingly, the OIC commercial services exports constituted
only about 42 per cent of the total commercial services trade in 2017. However services exports
grew at an annual average rate of 4.3 per cent while services imports grew by 3.1 per cent during
2008-2017 period. Thus the share of services exports has increased over the last decade from
39 per cent in 2008 to 42 per cent in 2017.
Figure 37: Total OIC Commercial Services Exports and Imports
Source: UNCTADSTAT
-8.0
11.2
11.7
7.5
3.6
13.8
-6.4
-2.7
7.7
-10
-5
0
5
10
15
0
100
200
300
400
500
600
2008 2009 2010 2011 2012 2013 2014 2015 2016 2017
Billion USD
OIC Commercial Services Export
OIC Commercial Services Import
OIC Commercial Services Trade Growth (%)