


 38 / 133

30
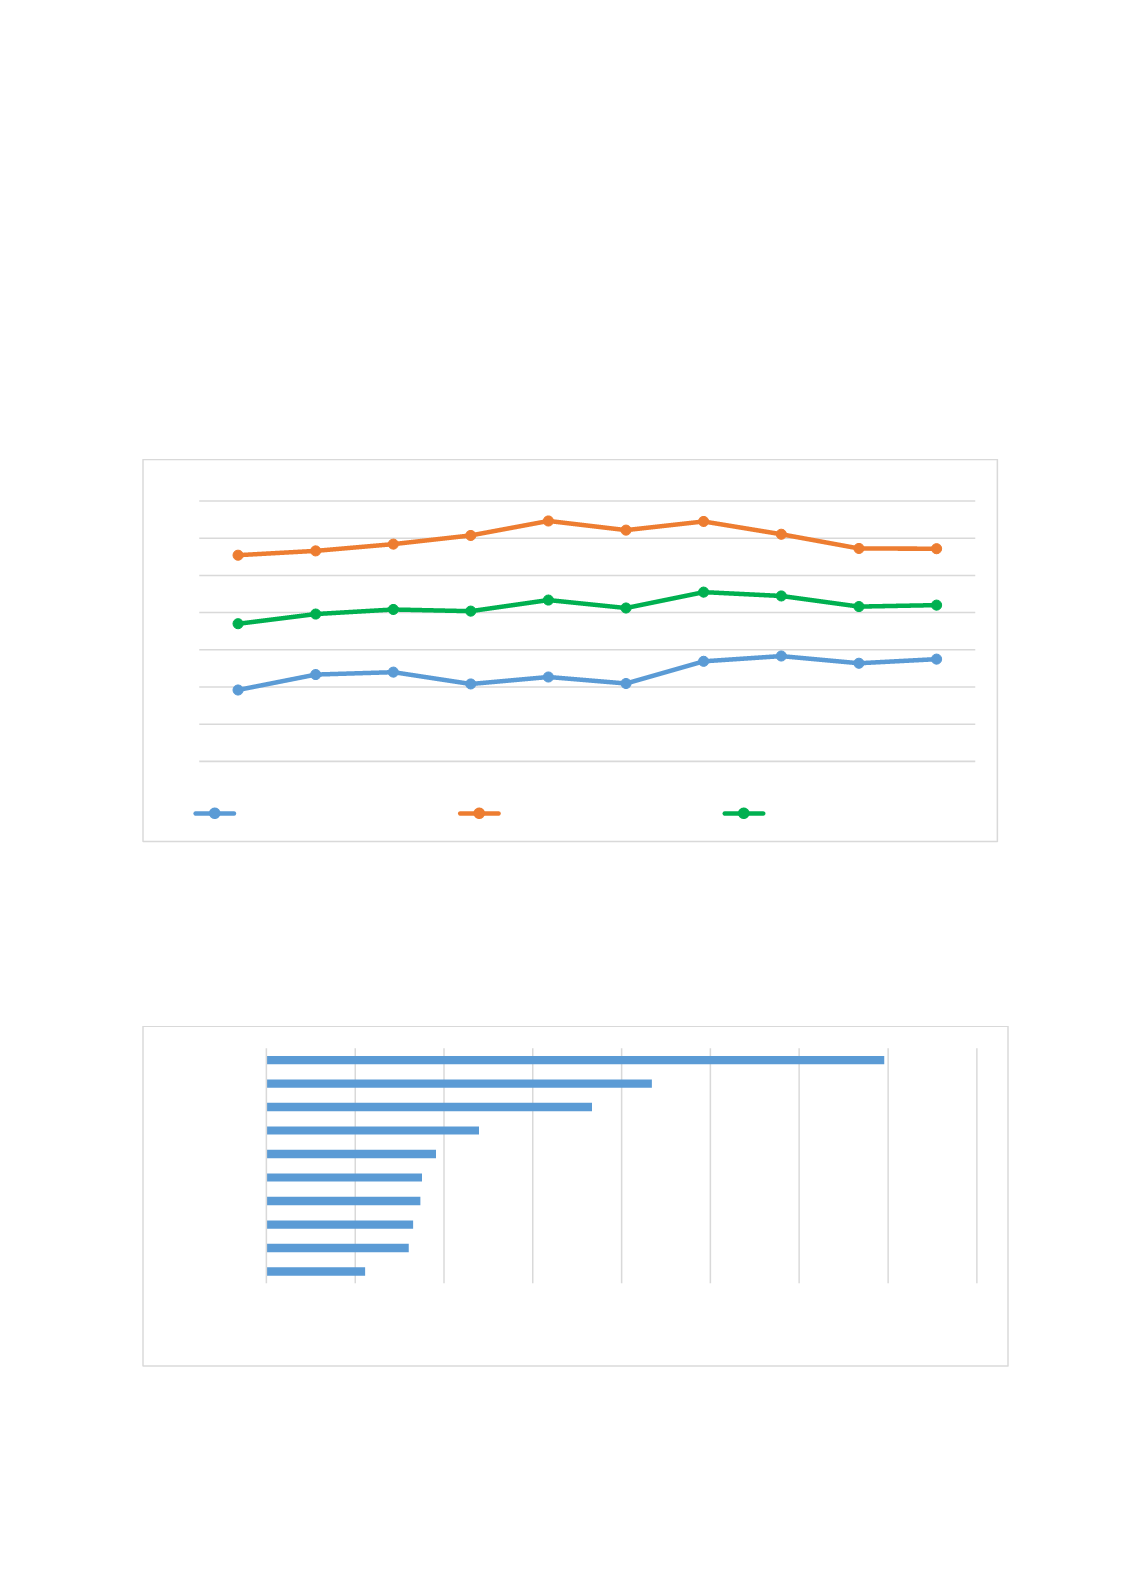
Regarding the share of the OIC in global economy, the OIC Member Countries have the share of
8.2 per cent in total global commercial services trade. Although this ratio peaked at 8.6 in 2014,
the share of the OIC has been gradually decreased in the last three years. Moreover, the share of
the OIC commercial services exports in global exports has been below vis-à-vis the share of the
OIC commercial services imports and total OIC commercial services trade. However, the share
of OIC services export in global commercial exports has slightly increased from 6.1 to 6.7 since
2013, whereas the share of OIC services imports decreased from 10.5 to 9.7 in the same period.
The Figure 38 below shows the recent trends regarding the share of the OIC in global services
trade.
Figure 38: Share of OIC in Global Commercial Services Trade
Source: UNCTADSTAT
The top performers in total OIC commercial services exports were the United Arab Emirates,
Turkey and Malaysia. The commercial services exports in the OIC mainly concentrated on the
top ten performers demonstrated in Figure 39. These countries as a whole represent 80.6 per
cent of the total OIC commercial services exports.
Figure 39: Top Commercial Services Exporters among the OIC Member Countries, 2017
Source: UNCTADSTAT
5.9
6.3
6.4
6.1
6.3
6.1
6.7
6.8
6.6
6.7
9.5
9.7
9.8
10.1
10.5
10.2
10.5
10.1
9.7
9.7
7.7
8.0
8.1
8.0
8.3
8.1
8.6
8.5
8.2
8.2
4
5
6
7
8
9
10
11
2008 2009 2010 2011 2012 2013 2014 2015 2016 2017
per cent
OIC Exports / World Exports
OIC Imports / World Imports
OIC Trade / World Trade
0
10
20
30
40
50
60
70
80
Bahrain
Lebanon
Morocco
Saudi Arabia
Qatar
Egypt
Indonesia
Malaysia
Turkey
UAE
Billion USD