


 42 / 107

31
COMCEC Agriculture Outlook 2019
Value of Food Production:
Average value of food production, which provides a cross country
comparison of the relative economic size of the food supply in a country or region, is another
indicator to measure the availability aspects of food security. It is calculated in three yea r
averages, and expresses the food net production value, in constant 2004-06 international dollar
terms, per caput.
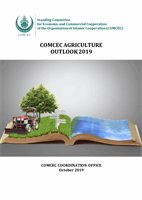
Figure 27 Average Value of Food Production in the OIC and the World
Source: Annex 36
Figure 27 shows the average value of food production from 1999-2001 to 2014-2016. As of
2014-2016, average value of food production in the OICmember countries reached 194 dollars
per capita, from 176 dollars in 1999-2001. Between these periods, it has increased by 10
percent. However, in 2014-2016, OIC average value of food production per caput was almost 38
percent lower than theworld average.
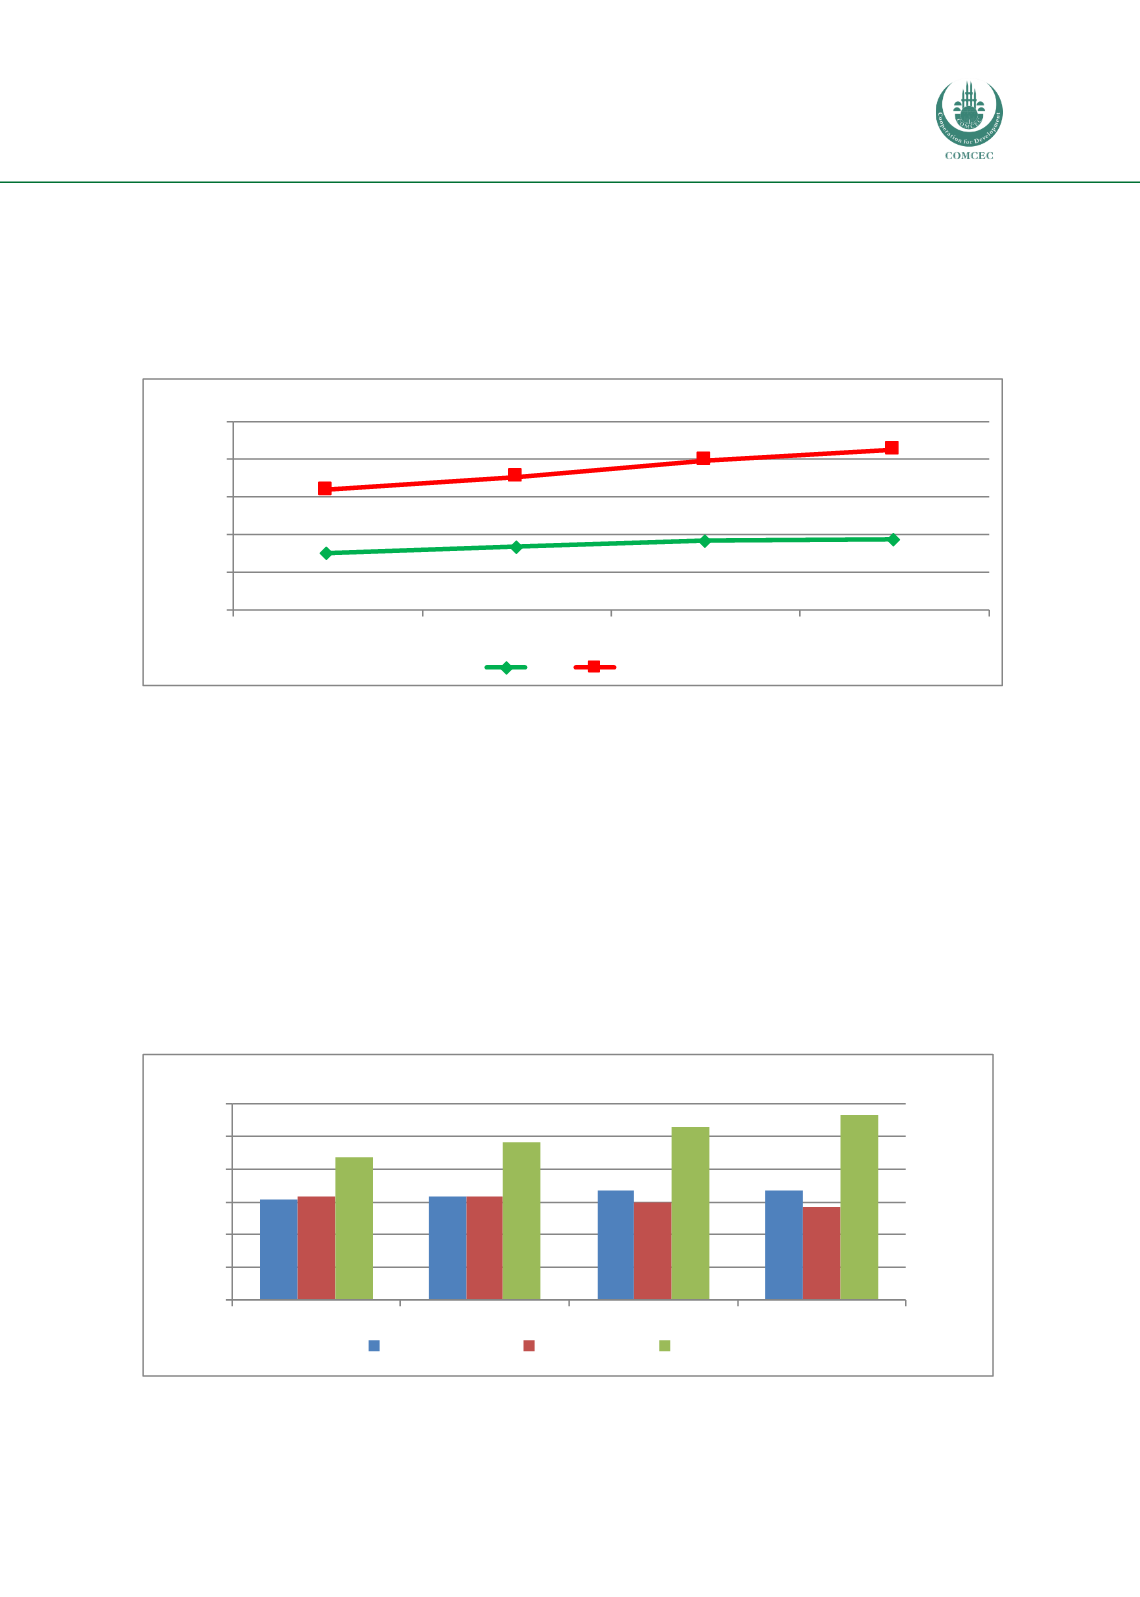
At the sub-regional level, Asian Group has the highest average value of food production per caput
with 283 dollars, increasing by over 30 percent from218 dollars in 1999-2001. As of 2014-2016
period, Asian Group was followed by African Group and Arab Group with 168 and 141 dollars
per capita respectively. The growth of average value of food production in African and Arab
Groupswere below10 percent (Figure 28).
Figure 28 Average Value of Food Production in the OIC Sub-Regions
Source: Annex 36
176
184
192
194
260
277
299
313
100
150
200
250
300
350
1999-2001
2004-2006
2009-2011
2014-2016
Int. $ per caput
OIC
World
153
158
168
168
158
157
148
141
218
241
265
283
0
50
100
150
200
250
300
1999-2001
2004-2006
2009-2011
2014-2016
Int. $ per caput
African Group Arab Group Asian Group