


 21 / 107

10
COMCEC Agriculture Outlook 2019
%
55
52.8
50
48.0
45.5
45
40
48.2
46.3
42.1
35
30
25
1990
1995
2000
2005
2010
2016
30.8
35.6
.
36.0
39.6
38.3
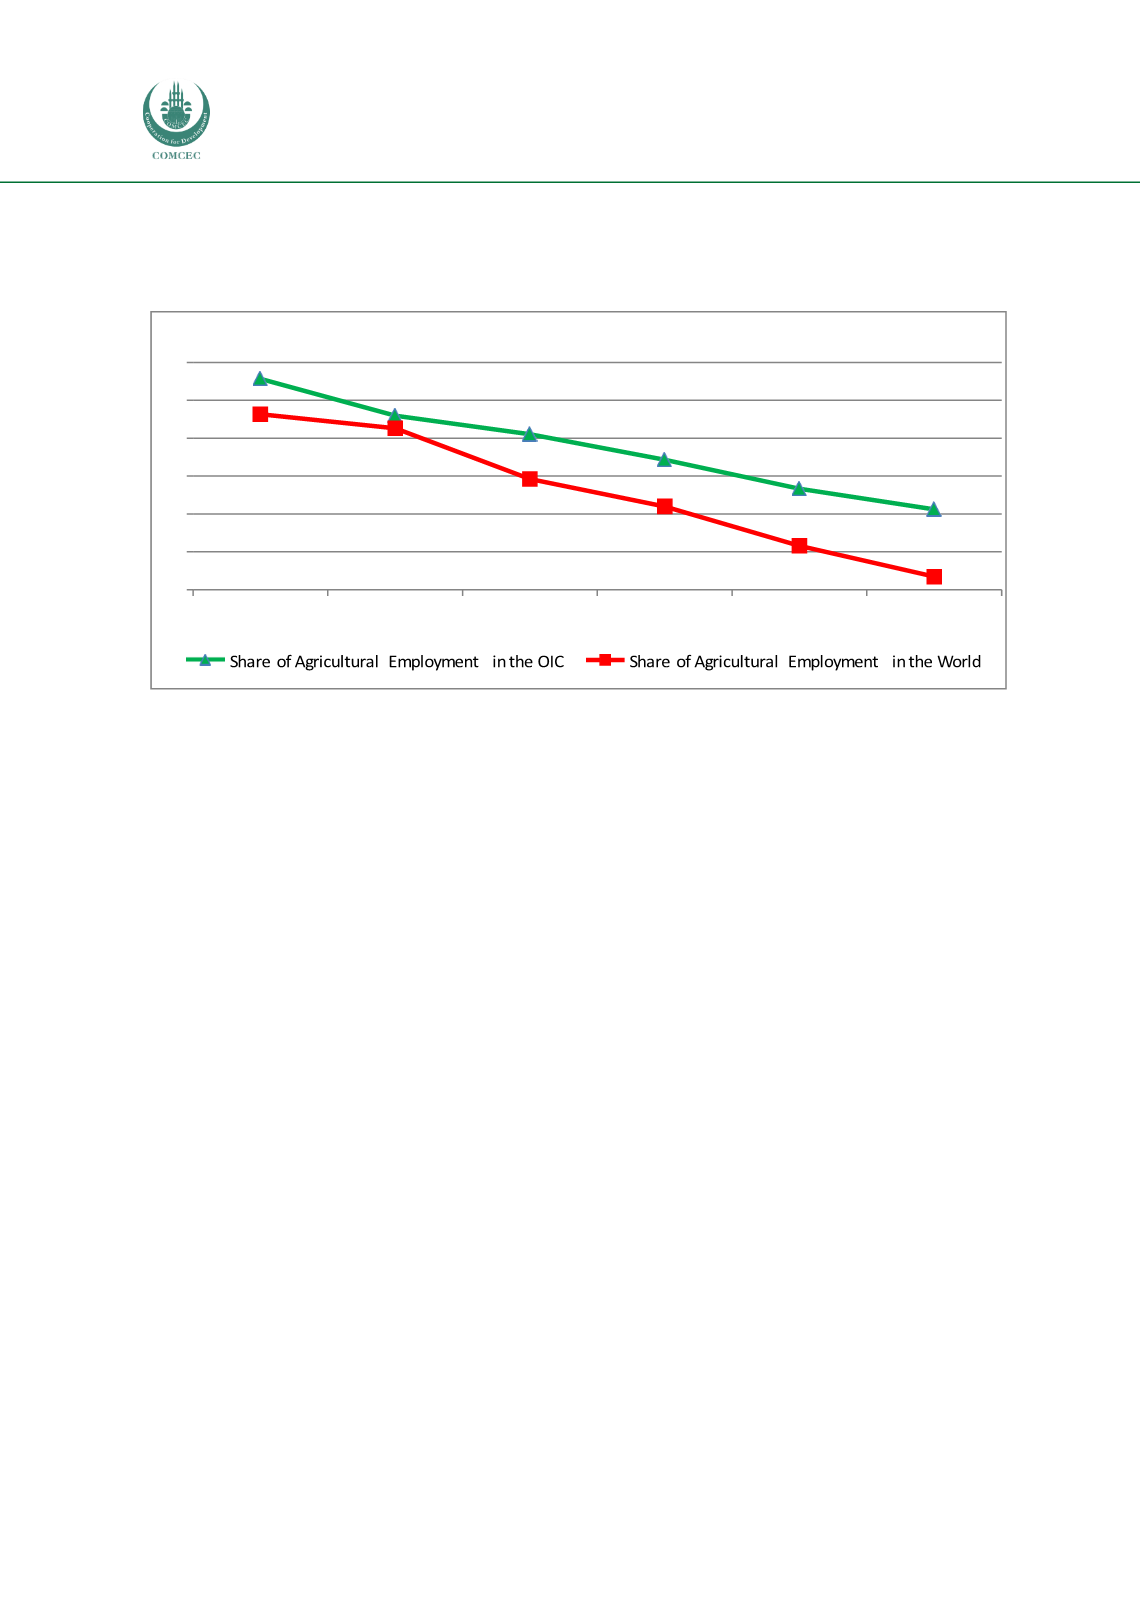
proportion of agricultural
employment is
realized as 35.6 percent in the OIC and 26.7 percent
in theworld.
Figure 7 Share of Agricultural Employment in the OIC and World
Source: Annex 10 and 11
The decline in the proportion of agricultural employment can be explained by biological,
chemical, and mechanical advances eliminating many plantation, cultivation and harvesting
task, increasing agricultural productivity, rapid urbanization, and non -farm activities
providing an increasingly important share of rural incomes.
1.5 Agricultural Trade
This section discusses the change in the aggregate trade of the OICmember countries. Data used
for the aggregates are retrieved from Trade Map which is a customized data repository tool
developed by International Trade Center of UNCTAD/WTO (TRADEMAP). Unless otherwise is
stated, “Total agricultural products trade” covers agricultural and food products as well as
agricultural raw materials (SITC sections 0 (Food and Live Animals), 1(Beverage & Tobacco),
2(CrudeMaterials), 4(Animal and Vegetable Oils, Fats and Waxes, excl. 27&28)).
Agricultural commodity trade of the 57 OICmember countries increased considerably in the last
decade up to 2015. Total agricultural trade in the OICmember countries grew by more than 4
times during this period and reached 355 billion US Dollars in 2017 (Figure 8). In 2017, total
agricultural imports of OICmember countries reached 214 billion US Dollars, from 43 billion US
Dollars in 2001. Correspondingly, total agricultural exports of OIC member countries was 141
billion US Dollars in 2017 compared to 29 billion US Dollars in 2001.
26.7