


 44 / 103

COMCEC Agriculture Outlook 2018
33
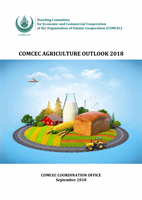
Average dietary energy supply adequacy in the OIC has become slightly higher compared to the
world recently.
Figure 25. Average Dietary Energy Supply Adequacy in the OIC and the World
Source: Annex 35
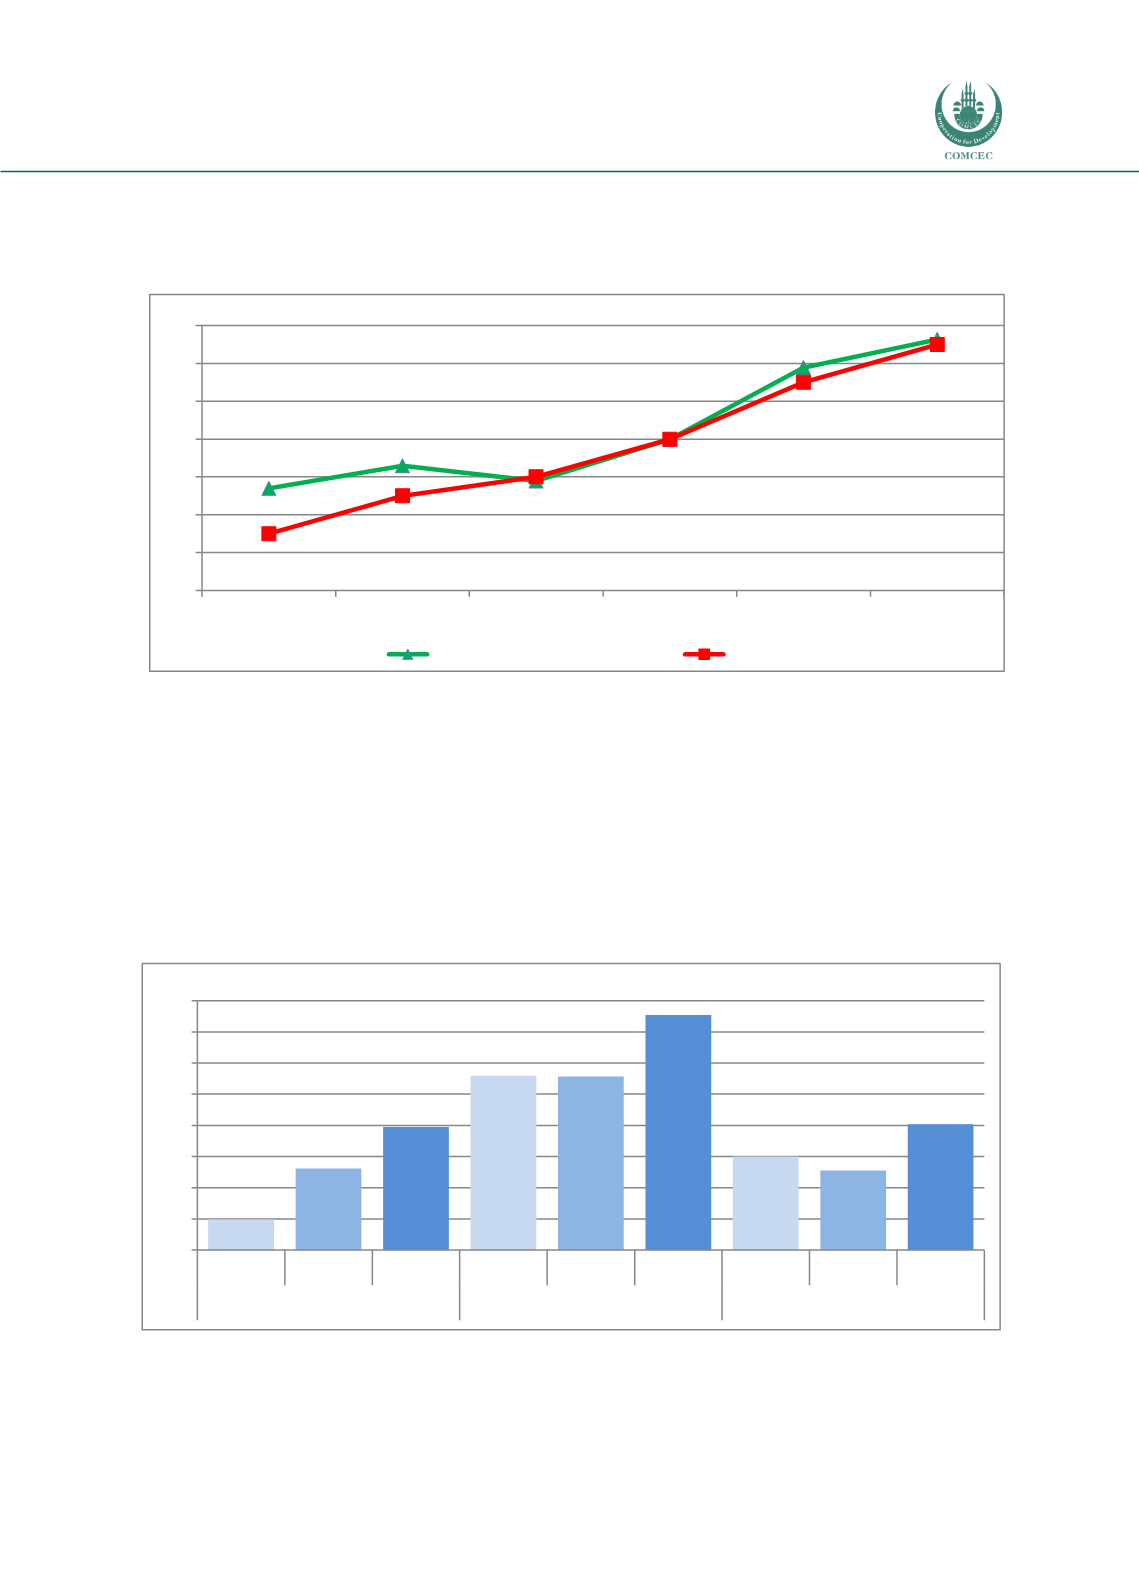
At the sub-regional level, average dietary energy supply adequacy is the highest in the Arab
Group with 138 percent in 2014-2016. Considering the adequacy rate of developed countries
which is 136 percent, Arab Group has moderately higher dietary energy supply adequacy than
developed countries. Arab Group is followed by Asian and African Group with 120 percent of
average dietary energy supply adequacy which is slightly lower than the world average. On the
other hand, even though the rate of growth in average dietary energy supply adequacy is higher
in the African Group, it is still below the OIC average.
Figure 26. Average Dietary Energy Supply Adequacy in the OIC Sub-Regions
Source: Annex 35
105
113
120
128
128
138
115
113
120
100
105
110
115
120
125
130
135
140
1990-92 2000-02 2014-16 1990-92 2000-02 2014-16 1990-92 2000-02 2014-16
African Group
Arab Group
Asian Group
Percentage
115,4
116,6
115,8
118,0
121,8
123,3
113,0
115,0
116,0
118,0
121,0
123,0
110
112
114
116
118
120
122
124
1990-92
1995-97
2000-02
2005-07
2010-12
2014-16*
Percentage
OIC
World