


 39 / 103

COMCEC Agriculture Outlook 2018
28
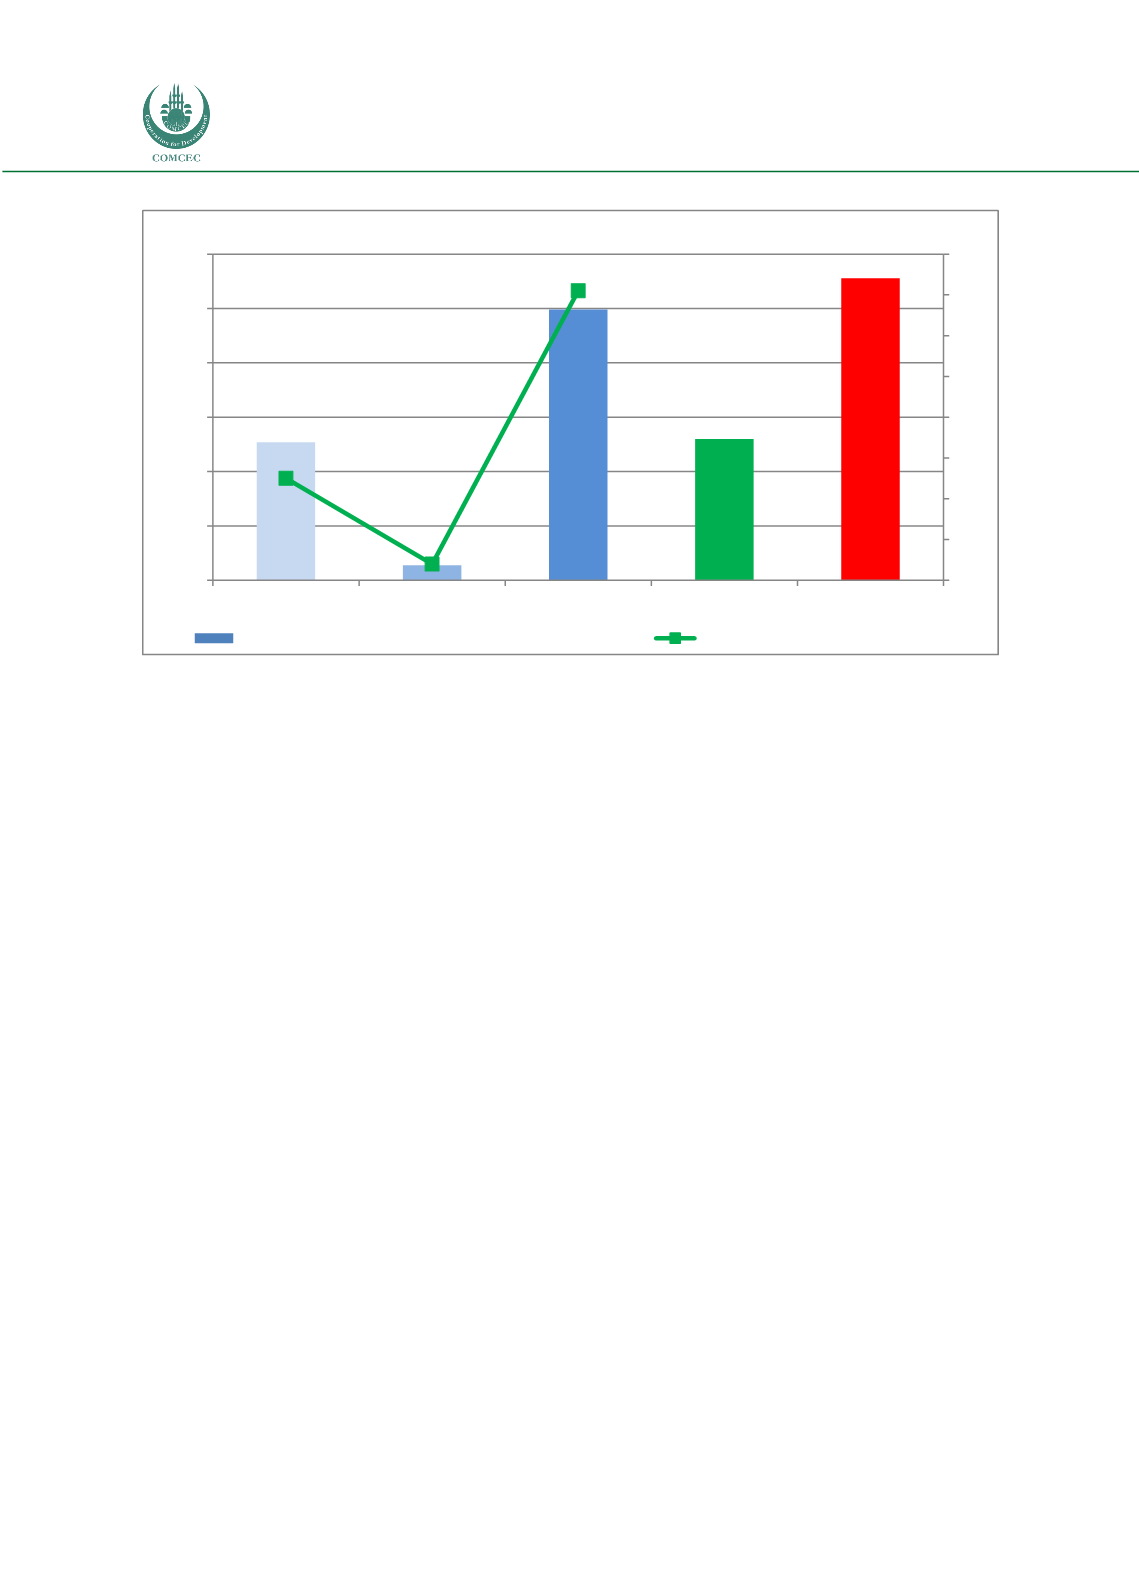
Figure 22. Renewable Water Potential in the OIC by Sub-Regions
Source: Calculated by using AQUASTAT and FAOSTAT
OIC member countries have 7,261 km
3
/year of renewable water resources for the period 2013-
2017 that accounts for 13.3 percent of the world’s total. Taking into account the fact that OIC
member countries have 28 percent of world’s total agricultural area, we can say that, the
majority of the Member Countries face water scarcity. This observation can be clearly seen from
Figure 22. Average renewable water resources per hectare of agricultural land in the OIC is
5,199 m3/ha, which is lower than half of the World’s average.
At the sub-regional level, renewable water resources disperse unequally in the OIC. Moreover,
the share of renewable water resources to the agricultural land varies considerably among its
sub-regions. While Asian Group has 71 percent of the renewable water resources in the OIC, it
possesses 9,965 m
3
/ha renewable water per hectare of agricultural land, Arab Group ownes 4
percent of renewable water resources with 554 m
3
/ha renewable water per hectare of
agricultural land.
Since OIC member countries are dispersed over a large geographical region, on four continents
and have wide range of climate conditions, big differences are seen at the country level regarding
amount of renewable water resources. In terms of their renewable water resources per hectare
of agricultural land, some OICmember countries are very richwhilemost of themare face water-
scarcity.
Table 7 and Table 8 indicate renewable water-rich OIC member countries and renewable water-
poor OIC member countries, respectively. Analyzing Table 7, it is seen that Suriname, Brunei
Darussalam have relatively high levels of water resources per hectare of agricultural land. They
are followed by Guyana, Bangladesh, Malaysia, Sierra Leone, Indonesia, Gabon, Cameroon, and
Albania.
5.079
554
9.965
5.199
11.114
% 25.0
% 4.0
% 71.0
0
10
20
30
40
50
60
70
80
0
2.000
4.000
6.000
8.000
10.000
12.000
African Group
Arab Group
Asian Group
OIC Average
World
Percent
m
3
/ha
Renewable Water Resources Per Hectare (left axis)
Share of RWR in the OIC (right axis)