


 14 / 103

COMCEC Agriculture Outlook 2018
3
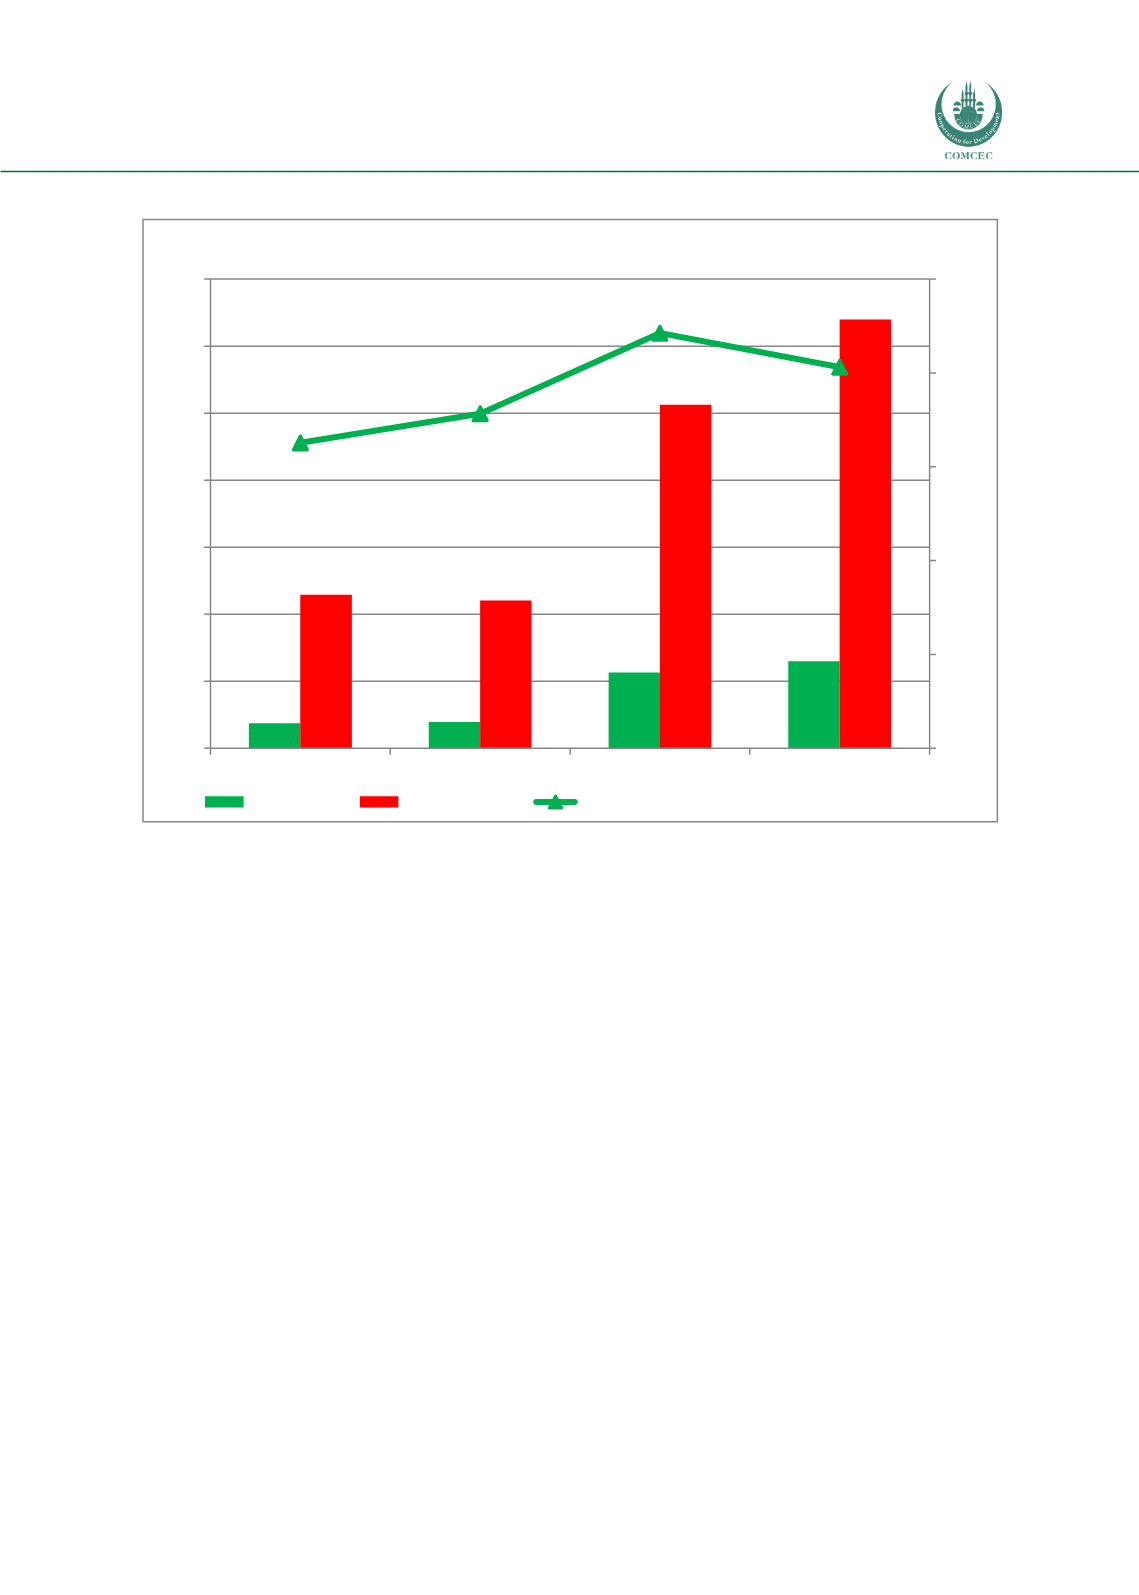
Figure 1. OIC Agricultural GDP and its Share in the World
Source: Annexes 2-6
The values of agricultural production in the OIC member countries have increased in the last
decades due to increases in production as well as higher prices. Figure 1 shows agricultural
sector’s contribution to GDP and its share in the world’s agricultural production. In 1990, OIC
agricultural GDP was 186 billion US Dollars with a share of 16 percent in the world’s agricultural
production. In 2016, OIC agricultural GDP reached 649 billion US Dollars with a share of 20
percent in the world’s agricultural production. This figure is important because it shows the
increasing importance of OIC agriculture in the world. However, OIC member countries have a
relatively lower performance in agriculture sector since, according to FAO, OIC member
countries own 29 percent of total world agricultural area as of 2015. Therefore, the potential of
agricultural sector in OIC member countries could be more effectively utilized to increase their
share in world agricultural output.
186
197
567
649
16
18
22
20,3
0
5
10
15
20
25
0
500
1.000
1.500
2.000
2.500
3.000
3.500
1990
2000
2010
2016
Percent
Billion Dollar
OIC Total
World Total
Share of OIC Agricultural GDP in the World