


 15 / 103

COMCEC Agriculture Outlook 2018
4
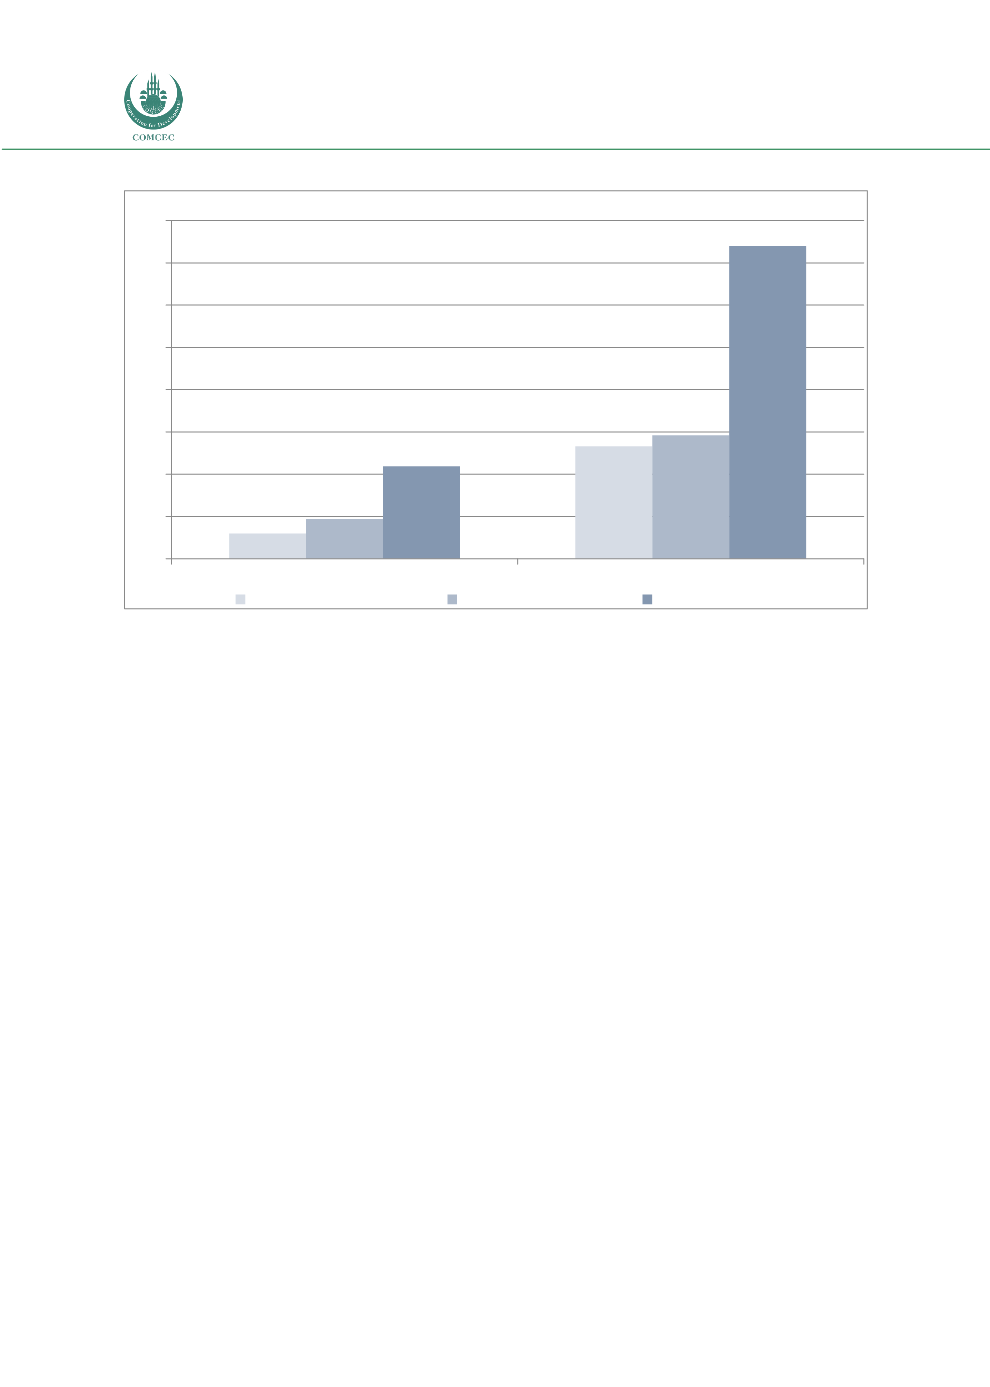
Figure 2. Agricultural GDP by Sub-Regions and their Share by Current Price
Source: Annexes 2-6
The OIC member countries are classified into 3 groups as African, Arab and Asian group. The
contribution to these groups to the OIC total agricultural value added varies considerable, and
it shows an uneven pattern over time. The relative performance of African Group is getting
strong compared to the Arab and Asian Groups in the period of 1990-2016. However, Asian
Group has the highest contribution to agricultural production over the years.
As of 2016, OIC agricultural GDP reached to 649 billion US Dollars and the contribution of Asian
group to this value is 370 billion US Dollars which is more than half of the total agricultural GDP
of the OIC Member Countries. Hence, Asian Group has the highest amount of the agricultural
GDP, and followed by African Group and Arab Group with almost 133 billion and 146 billion US
Dollars, respectively. From 1990 to 2016, the share of African group agricultural GDP in OIC
agricultural GDP increased to 24 percent from 16 percent. On the other hand, the share of Arab
Group agricultural GDP in OIC agricultural GDP decreased to 22 percent from 25 percent in the
same period.
0
50
100
150
200
250
300
350
400
1990
2016
Billion Dollar
African Group
Arab Group
Asian Group
16.05
%
25.2 %
58.7
%
24.0
%
22.2 %
53.8 %