


 17 / 103

COMCEC Agriculture Outlook 2018
6
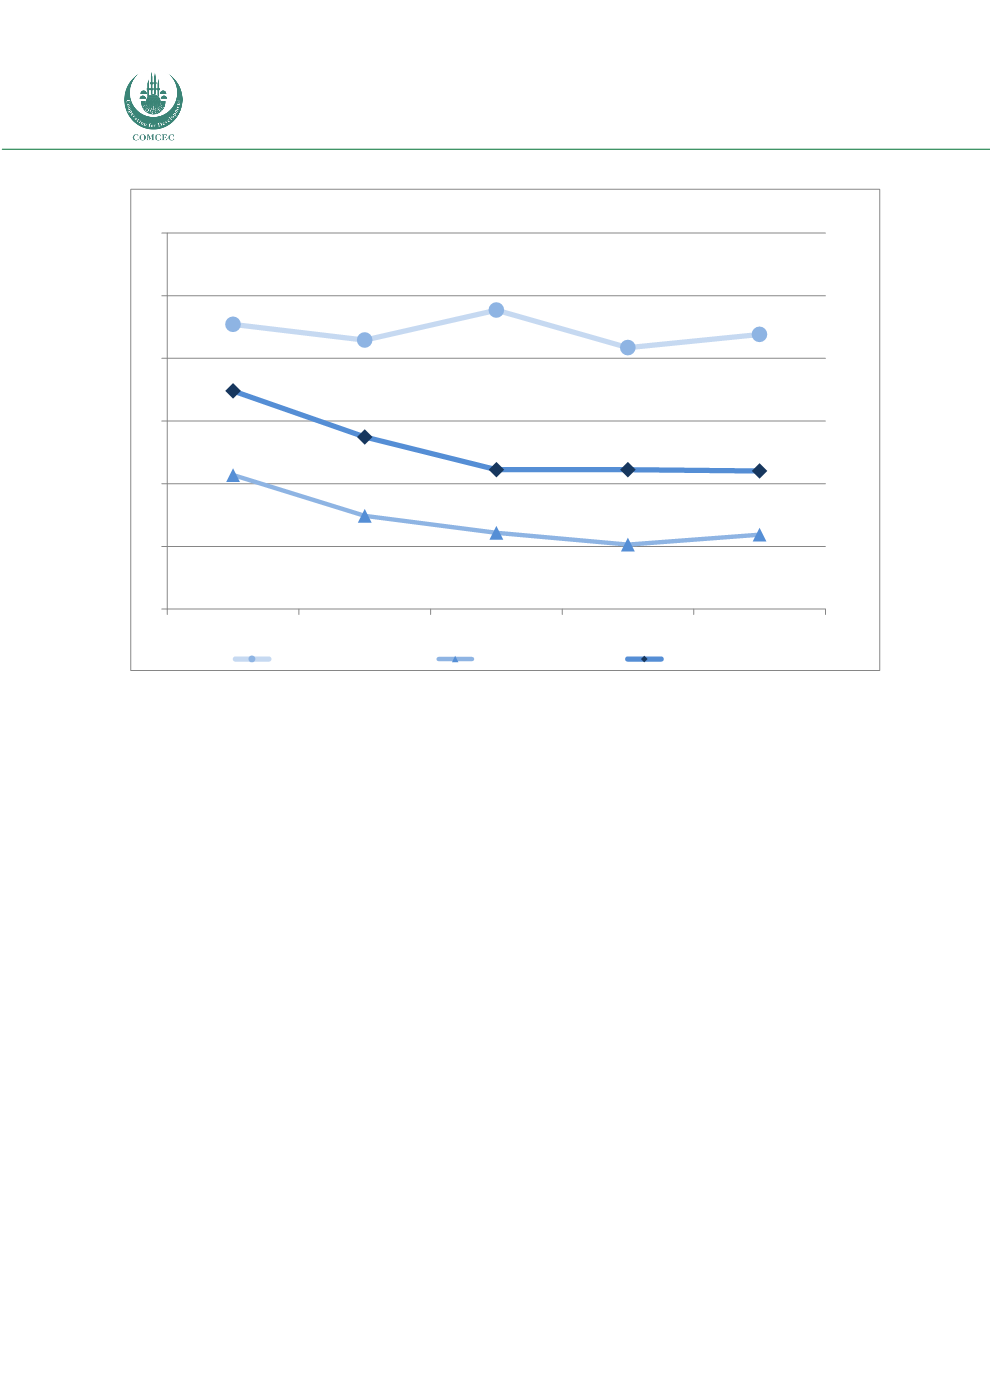
Figure 4. Share of Agricultural GDP in Total GDP by Sub-Regions
Source: Annexes 2-6
The share of agriculture sector in total GDP varies significantly across regions in the OIC. African
Group has the highest share of agricultural GDP, with 21.9 percent in 2016. It is followed by
Arab and Asian groups with 11.0 percent and 5.9 percent, respectively. Even though the relative
contribution of agricultural activity to the economy has shown fluctuations in African Countries,
it registered a still declining path in both Arab and Asian Countries.
Table 1 illustrates the top 10 OIC member countries with respect to agricultural value added
and share of agricultural sector in their economies in 2015 and 2016. Indonesia has the highest
agricultural value added in the OIC with 126 billion US Dollars, which accounted for the 13.5
percent of total GDP in 2016. Nigeria was the second country with 85 billion US Dollars and its
agricultural GDP constituted 21 percent of the total GDP. In 2016 top ten countries produced
511 billion US Dollars of agricultural GDP, whichwas more than 78.7 percent of total agricultural
GDP of 57 OIC member countries.
The importance of agricultural sector in the top ten member countries differs across countries.
For instance, in 2016, the share of agricultural GDP in country’s total GDP was the highest in
Sudan with 27 percent. In the top ten country rankings, Turkey, Iran and Malaysia were only
three countries whose shares of agriculture sector in the economy were lower than 10 percent
in 2016.
22,7
21,5
23,9
20,9
21,9
10,7
7,4
6,1
5,1
5,9
17,4
13,7
11,1
11,1
11,0
0
5
10
15
20
25
30
1990
2000
2010
2014
2016
Percentage
African Group
Arab Group
Asian Group