


 19 / 42

COMCEC Financial Outlook 2018
11
The above Figure on the number of bank branches is consistent with the bank account as both
clearly indicates a low level of financial access recorded for the low-income group of OIC
countries which reached to 3.7 branches per 100,000 adults in 2016 while the world average
realized as 22.4 in the same year. Unlike the previous indicator, the UMIG and HIG groups of the
OIC have shown lower performance than the world averages across the selected period.
Throughout 2012 to 2016, the rate has been realized around 14 branches for both OIC groups
of UMIG and HIG. Although the financial markets and instruments have been recorded
considerable growth and diversified significantly over the years, the branches have not
increased in parallel. Among other factors, this fact can be explained by the widespread usage of
branchless/internet banking.
As a result, the policymakers in the low-income group countries should focus on enhancing the
banking activities and access to financial markets by investing on branchless banking initiatives
that have emerged as a cost-effective option in recent years.
Data on access to financial markets are more limited. Especially for those countries with low-
income level and undeveloped stock exchange markets, the data is very scant. Measures of
market concentration are utilized to have an idea on the level of access to stock and bond
markets. Regarding this, we used the
Market capitalization excluding top 10 companies to
total market capitalization (%)
to approximate access to financial markets. This ratio is
calculated as ‘value of listed shares outside of the ten largest companies to the total value of all
listed shares’.
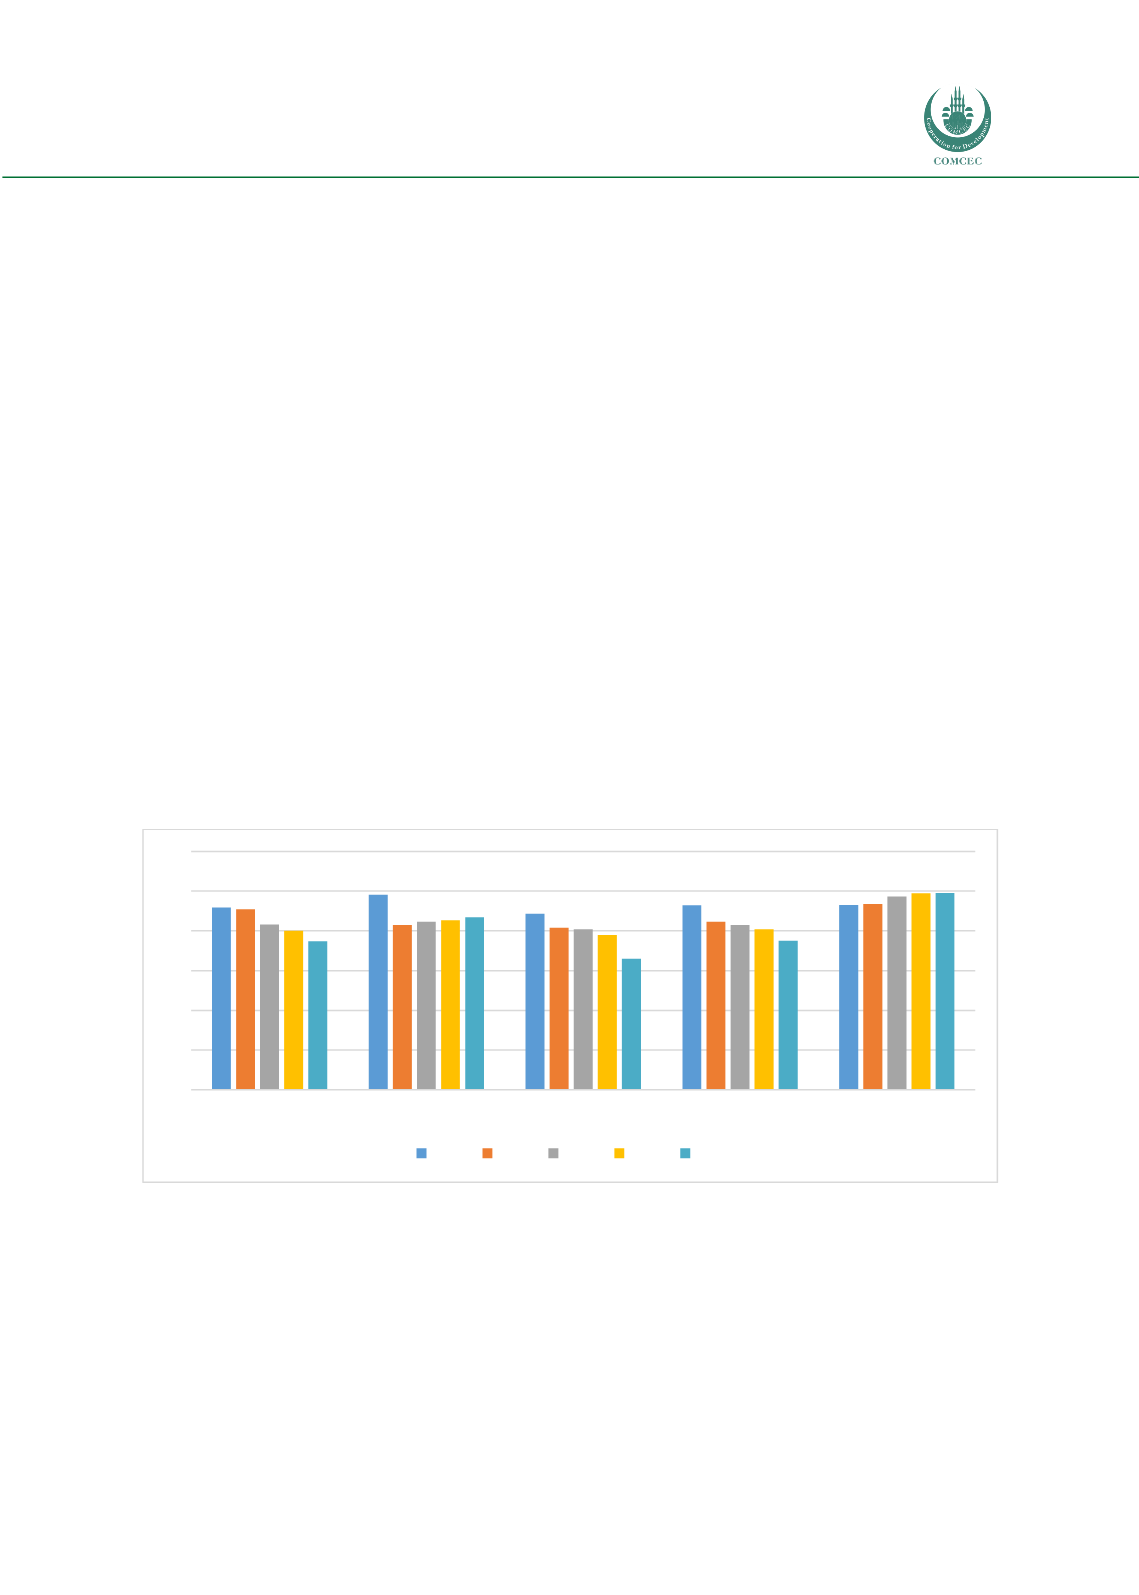
Figure 6: Market Capitalization Excluding Top 10 Companies to Total Market Capitalization
(%)
Source: Authors’ calculation from the World Bank Database
The world average hovers around 50 percent over the years from 2012 to 2016. As for the OIC
countries, the ratios for all groups are fluctuating around 38 percent during the same period. As
this ratio increases across the countries and country groups, it should be interpreted that the
value of outstanding shares of comparatively smaller companies is increasing in the market and
meaning access to the market is affected positively. Because the data is available only for those
countries that their markets have the maturity as well as the undeveloped nature of stock
0
10
20
30
40
50
60
OIC-LMIG
OIC-UMIG
OIC-HIG
OIC-Average
World Average
2012 2013 2014 2015 2016