


 22 / 42

COMCEC Financial Outlook 2018
14
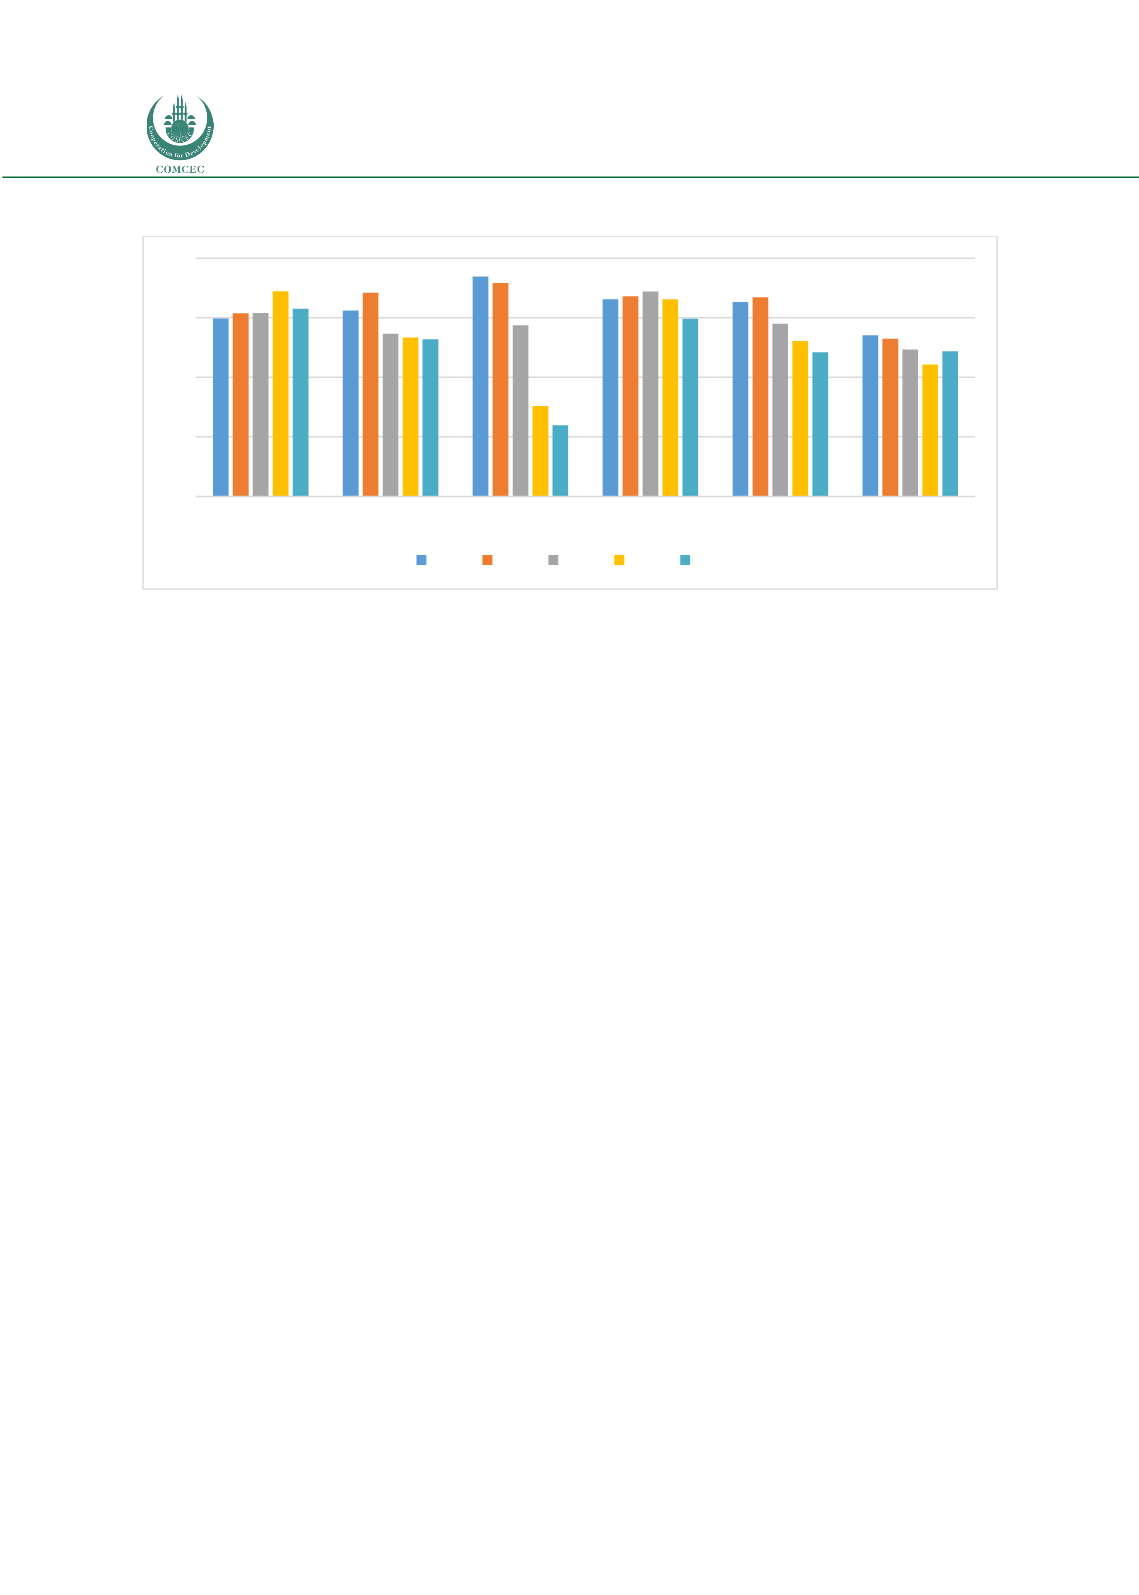
Figure 8: Bank Return on Assets (ROA) (%, after-tax)
Source: Authors’ calculation from the World Bank Database
As shown in the above Figure, OIC average ROA data is similar to the world average. Lower AOR
data could be interpreted as the efficiency of economies. Also, this situation could be explained
by weak asset base of financial intermediaries, lack of competition and shallow structure of the
market. The World average, which was realized as 1.4 percent in 2012, decreased over the
selected period and reached 1.2 percent in 2016. During the same period, the OIC average
decreased from 1.6 to 1.2 percent. ROA for OIC-HIG group performed better than all other
countries and realized at 1.5 percent in 2016.
Bank Return on Equity (ROE)
is another ratio used to measure the efficiency of financial
intermediaries. The ROE measures a corporation's profitability by revealing how much profit a
company generates with the money shareholders have invested. It is calculated as a ratio of
commercial banks’ after-tax net income to yearly averaged equity.
The Figure below shows the ROE data for OIC income groups and the World average
performance during 2012-2016 when the OIC group recorded a better performance than the
world. World average increased to 11.5 percent in 2016. It was 10.5 percent in 2015. OIC-LIG
countries had the highest rates across the OIC income groups. ROE for OIC-LIG countries
accounted for 15.7 percent in 2016.
0,0
0,5
1,0
1,5
2,0
OIC-LIG
OIC-LMIG
OIC-UMIG
OIC-HIG OIC-Average World Average
2012 2013 2014 2015 2016