
Financial Outlook of the OIC Member Countries 2017
27
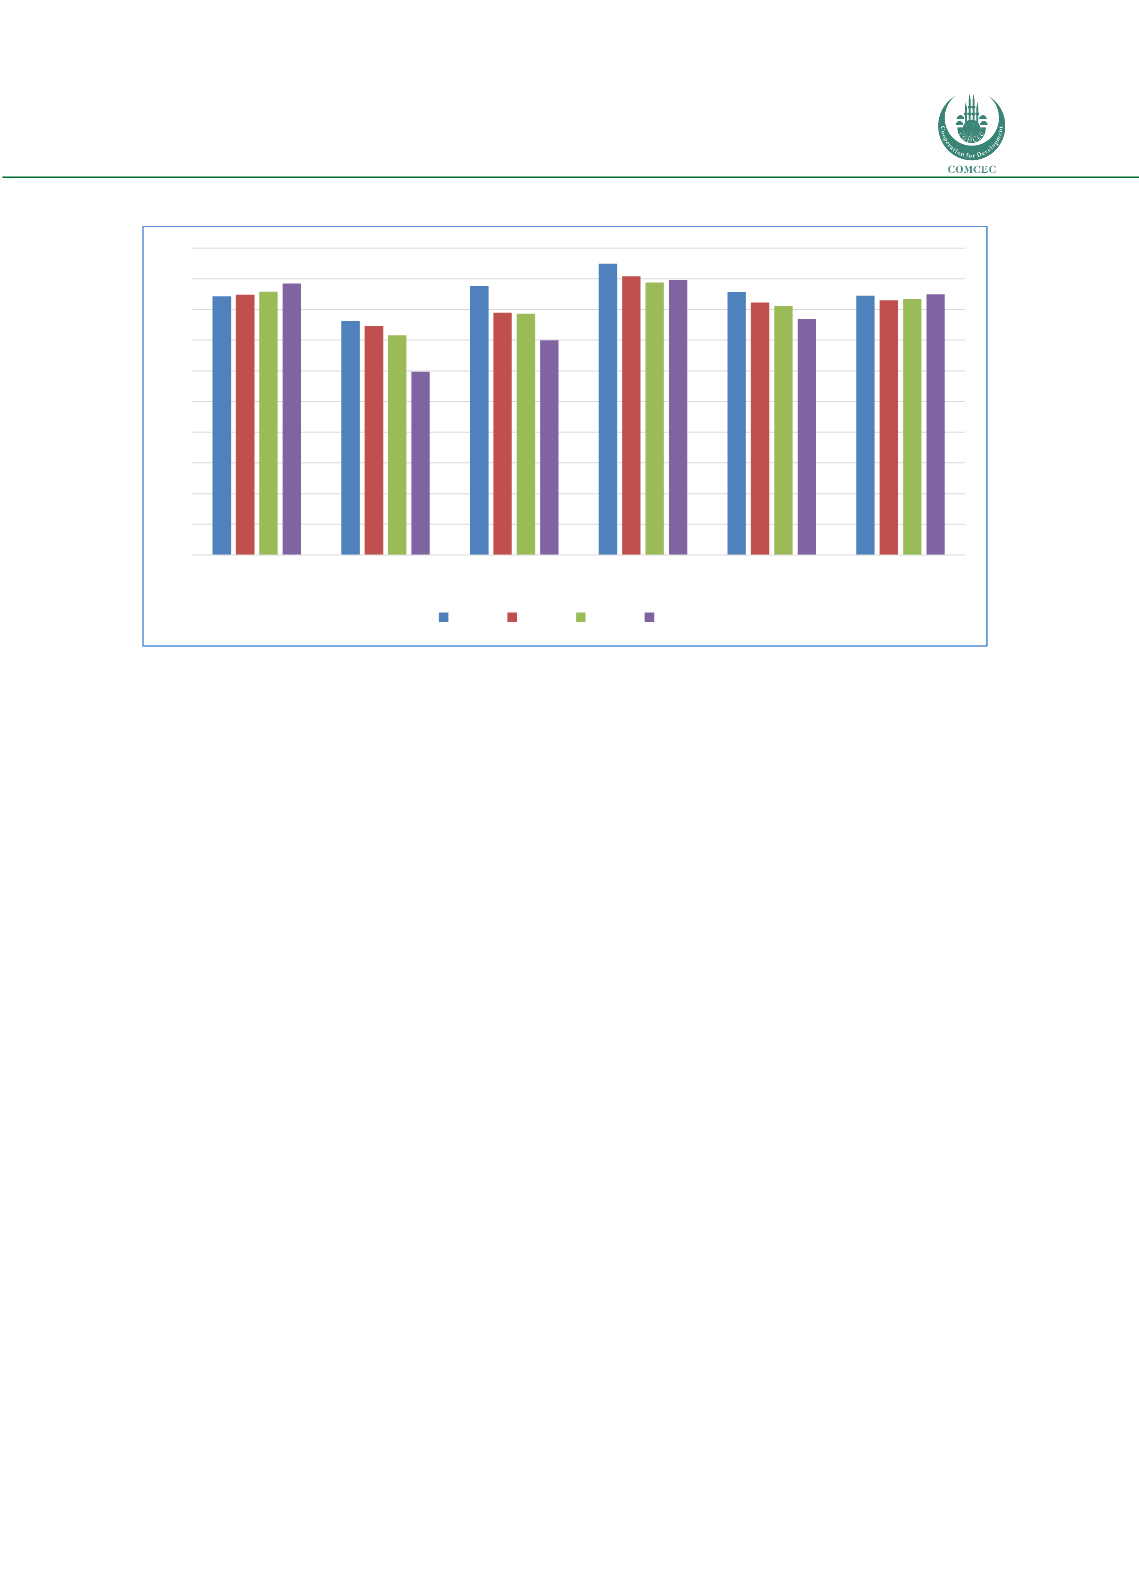
Figure 23: Bank Regulatory Capital to Risk-Weighted Assets (%)
Source: Authors’ calculation from the World Bank Database
Among the OIC income groups, OIC-LMIG and OIC-UMIG have the lowest scores in regulatory
capital to risk-weighted assets which realized as 14 and 15 percent respectively. Compared to
the other groups and the world average, these results make these countries more vulnerable
against financial stress.
Another indicator used to measure the stability of the financial intermediaries is the ratio of
bank capital and reserves to total assets
. Capital and reserves include funds contributed by
owners, retained earnings, general and special reserves, provisions, and valuation
adjustments. Capital includes tier 1 capital (paid-up shares and common stock), which is a
common feature in all countries' banking systems, and total regulatory capital, which includes
several specified types of subordinated debt instruments that need not be repaid if the funds
are required to maintain minimum capital levels (these comprise tier 2 and tier 3 capital).
Total assets include all nonfinancial and financial assets.
Average of the OIC-HIG countries shows better performance than any other OIC groups and the
World average. After reaching 13 percent for the years 2012 and 2013, the ratio slightly
declined and realized as 10.8% for the OIC-HIG group. On the other hand, the other OIC groups
have performed around the world average during the selected period.
0
2
4
6
8
10
12
14
16
18
20
OIC-LIG
OIC-LMIG OIC-UMIG
OIC-HIG OIC-Average World Average
2012 2013 2014 2015


