
Financial Outlook of the OIC Member Countries 2017
24
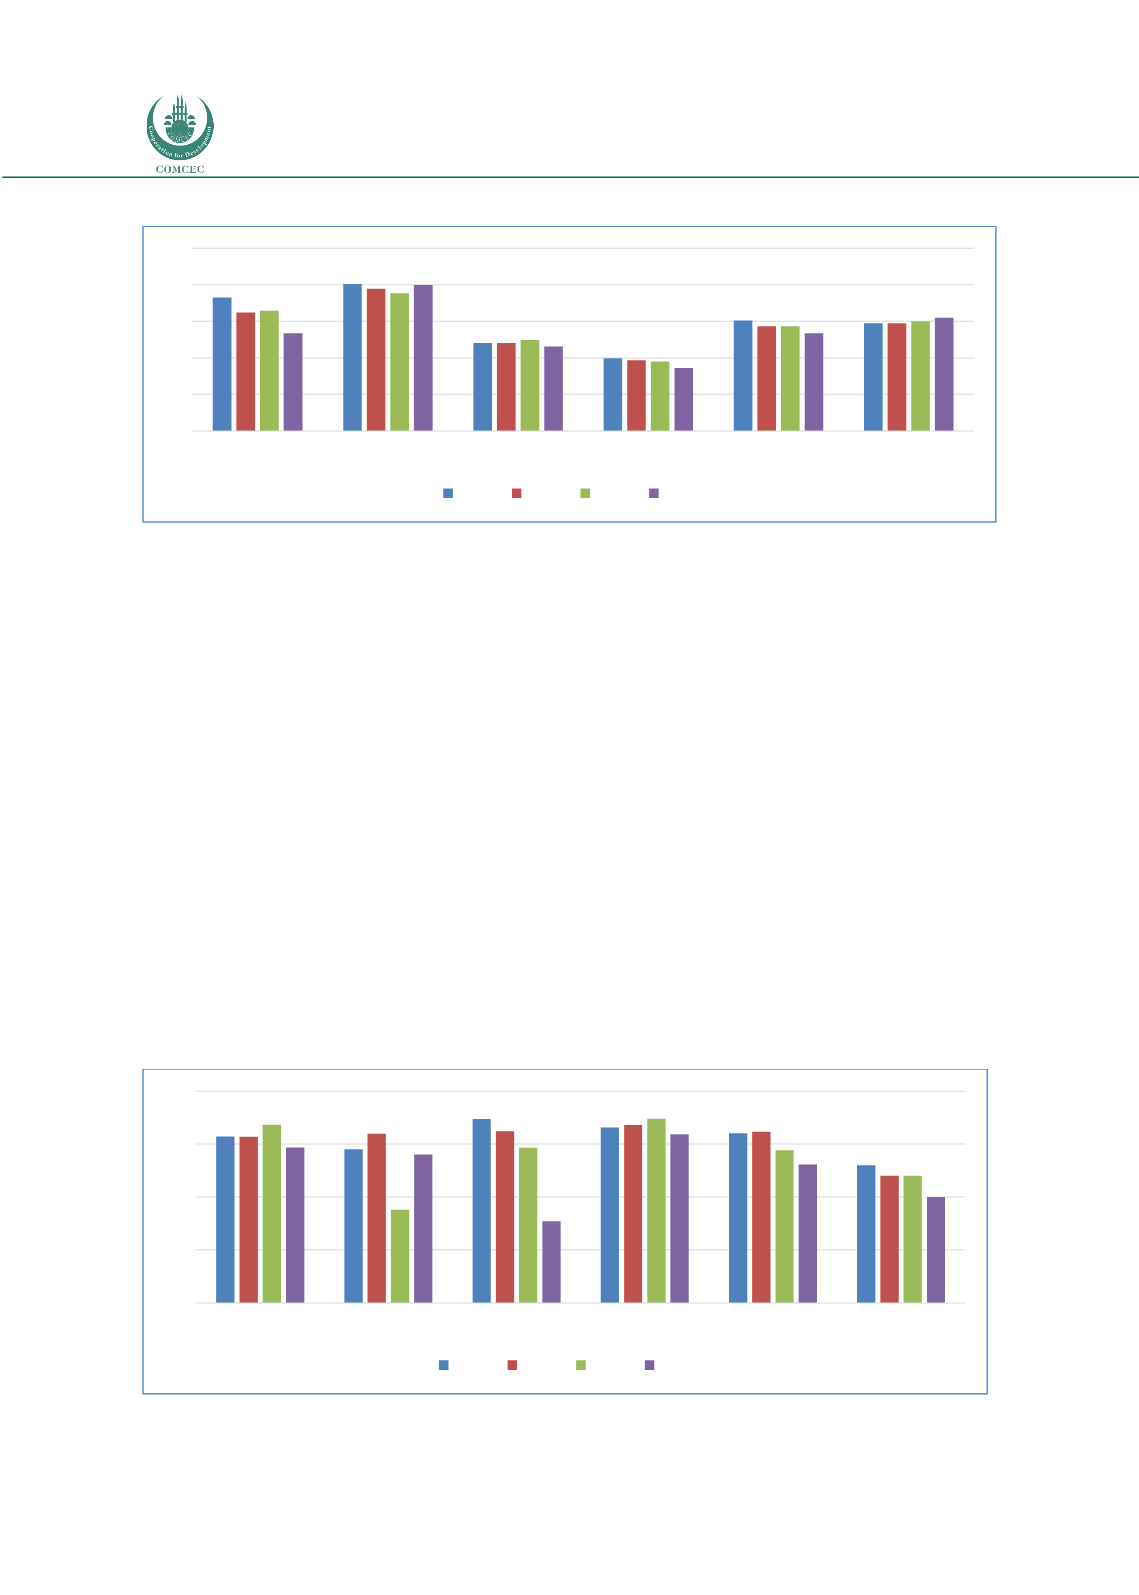
Figure 20: Bank Lending-Deposit Spread (%)
Source: Authors’ calculation from the World Bank Database
There is an indirect correlation between the level of economic development and interest rate
spreads as shown in the above figure as the advanced and high income economies tend to have
lower spreads than the lower income groups. As the financial markets become more developed
and institutional structure of the financial system is more mature, the competition among the
intermediaries goes up leading interest rate spreads decrease. This paves the way for better
economic environment and conducive atmosphere for investment.
The above figure shows that OIC-LIG and OIC-LMIG lending deposit spread which was around
7 and 8 percent respectively during the selected period were relatively higher than the OIC
average rate. On the other hand, the spreads of OIC-UMIG and OIC-HIGH were quite lower than
the world average and realized as around 5 percent and 4 percent respectively during the
same period.
Bank Return on Asset (ROA)
is another indicator used to measure the efficiency of the
financial intermediaries. This is calculated as a ratio of commercial banks’ after-tax net income
to yearly averaged total assets. This indicator measures the profitability of a company relative
to its total assets. Therefore, it gives an idea about the efficiency of a financial intermediary on
using its assets to generate earnings. The higher ratio indicates better performance for
individual corporations and banks as well as for the financial system as a whole.
Figure 21: Bank Return on Assets (ROA) (%, after tax)
Source: Authors’ calculation from the World Bank Database
0
2
4
6
8
10
OIC-LIG
OIC-LMIG OIC-UMIG
OIC-HIG OIC-Average World Average
2012 2013 2014 2015
0,0
0,5
1,0
1,5
2,0
OIC-LIG
OIC-LMIG OIC-UMIG
OIC-HIG OIC-Average World Average
2012 2013 2014 2015


